
Thirty percent of U.S. households now report a current GLP-1 user. Those households still outspend non-users on food and beverage at retail, but the mix of products in their carts keeps changing the longer they stay on the medications, according to Circana research presented during a recent webinar.
“So this isn’t a story of consumers simply buying less food or spending less when it comes to food and beverage at retail,” said Daniel Joyner, consultant, consumer and shopper insights at Circana. “It’s really a story of reallocation of spend as households settle into treatment.”
Joyner presented the findings in “GLP-1 Unlocked: The Next Phase of Consumer and Retail Transformation” with Sally Lyons Wyatt, global EVP and chief advisor, consumer goods and foodservice insights at Circana.
Spending shifts, not shrinks
According to Circana’s September 2026 receipt panel survey, 37 percent of polled households report someone has used a GLP-1, compared with 17 percent in 2024.
Before treatment, GLP-1 households spent about 8 percent more than nonuser households on CPG food and beverage, for a spending index of 108. After treatment began, that index fell 2.5 points in the first year and 1.9 points in the second year compared with the pre-treatment baseline. Of 301 food and beverage subcategories, 81 posted gains in the first year and 117 in the second.
In beverages, refrigerated weight control and nutritional liquids and powders rose 72.1 index points in the first year and 84.2 points in the second. Carbonated soft drinks were flat in the first year and rose 8.2 points in the second, while water declined in both years.
Indulgence returns on new terms
Total retail alcohol was down 6.5 points in the first year and 10.2 points in the second. Wine was the exception, moving from a 2-point decline to a 3.4-point gain.
“This is more of a shift toward fewer occasions or more selective drinking occasions, rather than a complete wholesale exit from the category,” Joyner said.
Candy and frozen desserts declined at first, turned positive in the second half of the first year and were up 5.7 and 5.3 points in the second year.
“Households using GLP-1 don’t appear to be abandoning indulgence permanently,” Joyner said. “Instead, they’re taking time to reintroduce treats in a way that fits with their new appetites and routines.
“And for brands and retailers, this points toward opportunities around smaller portions and products that can deliver satisfaction, maybe some permissible indulgence to users while they’re on their GLP-1 journeys.”
Protein and portability win
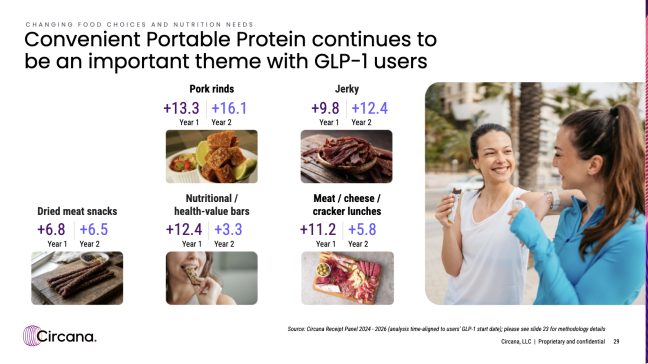 Prepared foods and soup also gained. Refrigerated lunches rose 11.6 points in the second year, and shelf-stable prepared pasta and microwaveable dinners moved from small first-year declines to second-year gains of 11.1 and 10.5 points.
In the second year, pork rinds were up 16.1 points, jerky 12.4 points and meat, cheese and cracker lunch kits 5.8 points. Nutritional and health-value bars rose 12.4 points in the first year.
“These categories are certainly examples of products addressing several GLP-1 needs at once,” Joyner said. “They provide protein, they can work with smaller appetites, and they can work into more flexible eating occasions.”
Where early gains fade
Seafood is one category where early gains among GLP-1 users faded over time. Tuna rose 3.2 points in the first quarter of treatment and was down 5.2 points by the second year. Frozen, refrigerated and shelf-stable seafood also fell below baseline in the second year.
“The challenge to retailers and brands is sustaining that initial interest over the entire journey,” Joyner said. “And that may require some innovations around easier preparation, smaller pack sizes, portable formats, or just giving consumers clearer ideas how to incorporate seafood into simple meals and snacks.”
In produce, salads fell 5.4 points in the first year and 14.6 points in the second, while cherries rose 17.7 points and herbs 13.5 points in the second year.
“Nutritional value alone doesn’t necessarily determine whether a food works for GLP-1 users,” Joyner said. “Tolerability, portion size, texture, preparation all matter, as well.”
In cheese, processed cheese rose 5 points in the second year, while shredded cheese and cheese chunks declined in both years.
“Consumers are simply favoring the formats that work best for their changing appetites and eating occasions while they are taking GLP-1,” Joyner said.
Weight control liquids and powders rose 28.5 points in the first year and 26.6 points in the second, and gastrointestinal remedies were up 12 points and 8.5 points. About 7 in 10 current-user households reported at least one side effect in the past three months.
“This creates a significant opportunity to connect the dots for these consumers between nutrition, digestive care, hydration, weight management – all as part of the same shopping mission,” Joyner said.
Retail channels respond
By channel, grocery store spending among GLP-1 households slipped 1.9 points in the first year and 1 point in the second. Convenience fell 8.5 points in the first year, and e-commerce fell 7.1 points in the second. Drugstores rose 2.7 points and 6.6 points.
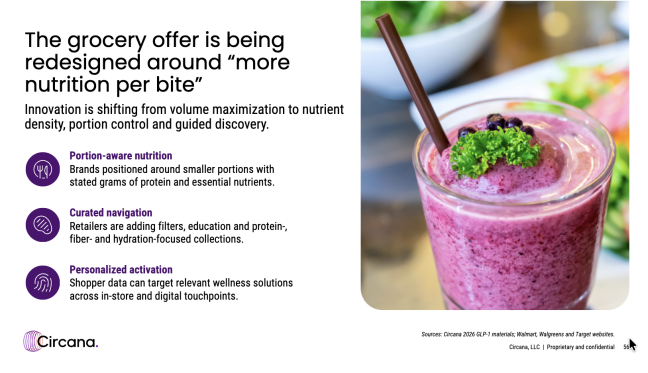 “Grocery can make smaller, more intentional baskets easier to shop,” Wyatt said.
She added that in grocery, “the emphasis is shifting toward more nutrient per bite, with portion-aware products and clearer information about protein and other nutrients. Curated collections, filters and education can connect innovation with easier discovery.”
Wyatt cited Walgreens, which organizes GLP-1 support in-store and online around four needs: nutrition, vitamins and minerals, gastrointestinal concerns and hair thinning. She also pointed to online resources and product collections from Walmart and Target.
“The distinction is organizing across aisles around consumer needs rather than leaving the shoppers making those connections themselves,” Wyatt said.
Forty-eight percent of previous-user households said they were at least somewhat likely to restart within a year. “Stopping may represent a pause rather than a final decision,” Wyatt said.
GLP-1 households now account for 32 percent of food and beverage units purchased. Circana projects that share will reach 40 percent by 2030, based on active use reaching 35 to 40 percent of U.S. households.
“So this is a conditional outlook rather than a guaranteed outcome,” Wyatt said. “For brands and retailers, I would use this as a planning signal.”