
By the time October arrives, most operators already have a feeling about how the year is going. You know if the register is keeping pace. You know if the meat case is carrying its weight. What you may not know is how that compares to the field.
 The 2026 U.S. Independent Grocers Financial Study, released by FMS and NGA in July, draws on 503 independent operators across nearly 2,000 stores. But the value of a benchmark is not in reading it. It is in knowing what to ask your own operation once you set it down. Here is where I would start.
The average is not the story
Independent grocers improved profitability last year. Total store gross margin rose from 27.4% to 27.9%. Net profit before taxes came in at 2.20%, up from 1.90%. EBITDA improved from 3.08% to 3.54%. Those are good numbers. They are also incomplete.
Same-store sales grew 0.4%. Adjusted for food-at-home inflation, real growth was negative 1.5%, and nearly 7 in 10 independents posted gains below the inflation rate. The improvement did not come from growth. It came from margin discipline and expense control, and a year built on discipline is a hard year to repeat.
Twelve times
The top 25% of operators, what the study calls profit leaders, averaged 6.7% net profit before taxes. The remaining 75% averaged 0.56%. Twelve times the profit, from stores selling largely the same products in largely the same markets.
Against the industry average of 2.20%, the leaders run 4.5 percentage points ahead. On a store doing $10 million, that is roughly $450,000 a year in difference. From the same business, run differently.
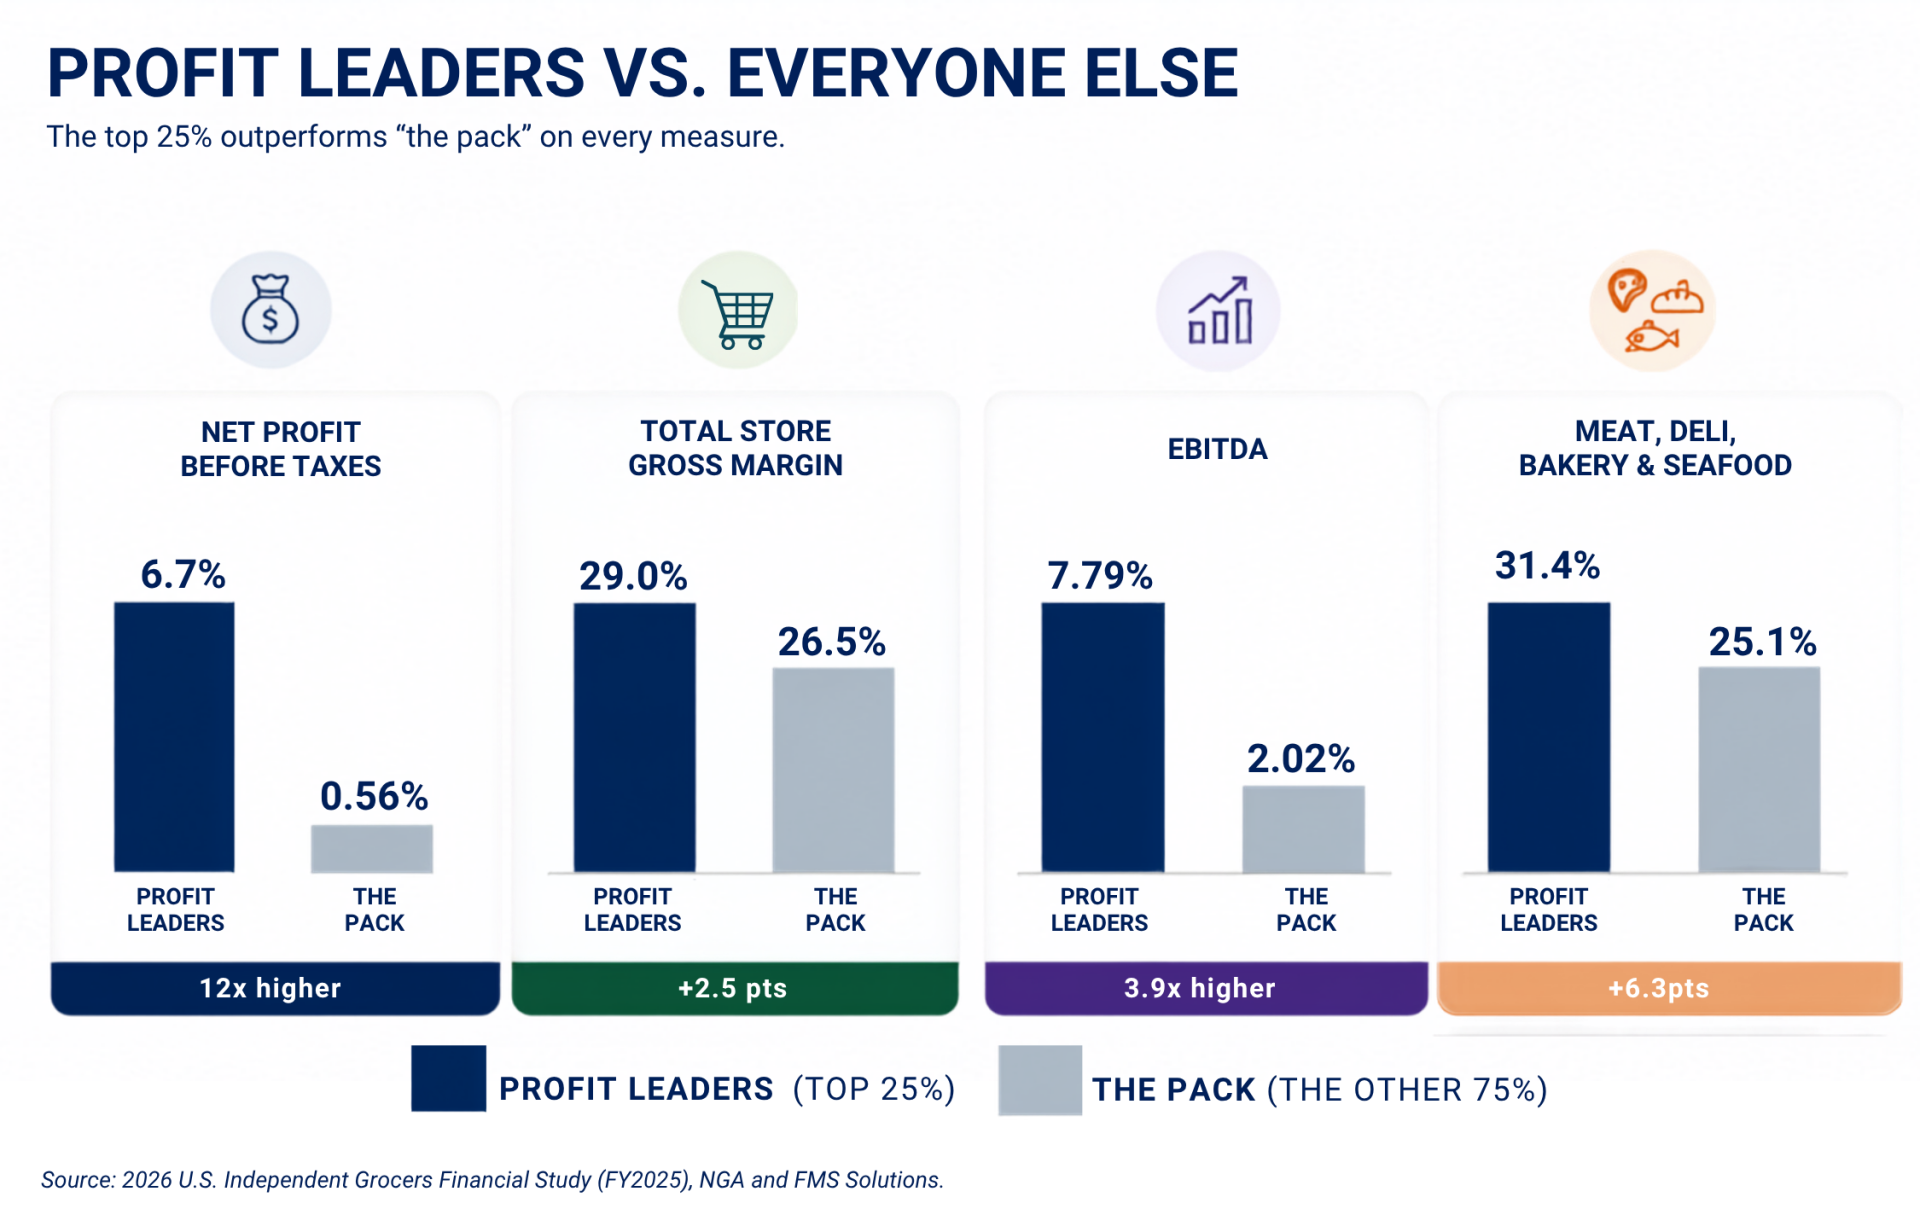
Four measures, one pattern. The leaders are ahead on every one, and the first three are largely explained by the fourth.
The gap lives on the perimeter
Meat, deli, bakery and seafood make up 31.4% of sales for profit leaders and 25.1% for the pack. Produce and floral add 11.5% against 9.2%. Together, about 43 cents of every sales dollar comes from the perimeter at a profit leader, against 34 cents at everyone else.
The report is direct about it: fresh perimeter differentiation is a clear strategy among profit leaders
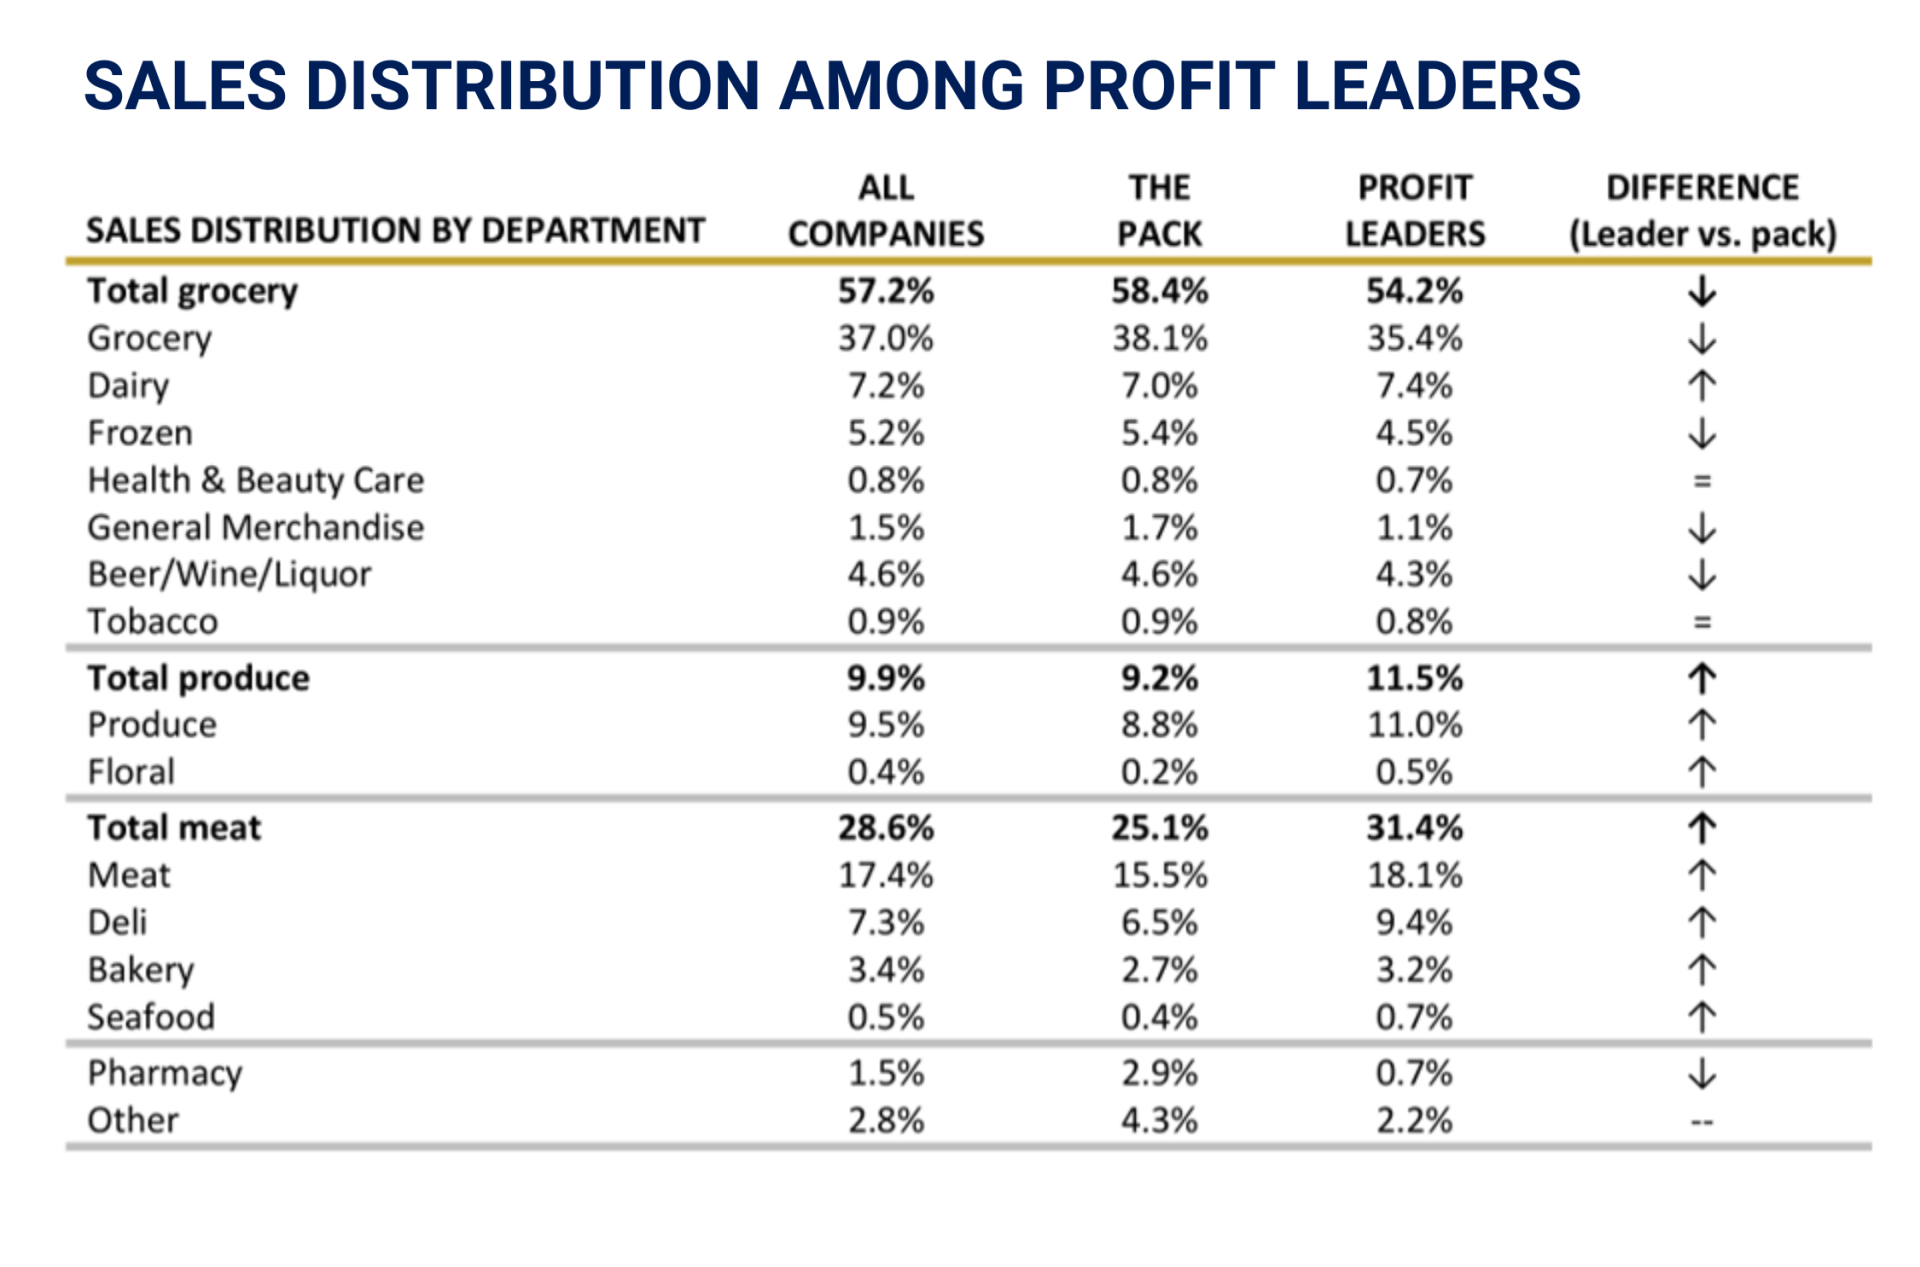
This is not a new finding. FMS has pointed to the perimeter as the difference-maker for independent operators for several years running. What changed is the size of the number attached to it. At twelve times the profit, nearly nine cents on the dollar stops being an observation and becomes the explanation.
This tracks with what I see in the field. When I sit down with an operator whose profit is lagging, perimeter share is one of the first things we look at, and it is usually low.
You will not out-price a supercenter on center store. You can out-execute one at the meat case and the deli counter. This is not a talent gap. It is a mix decision, made repeatedly, and measured often enough to correct.
Four numbers to pull this week
Compare yourself to the leaders, not to the average. The average is where the field is. The leader number is where the money is.
- Fresh perimeter share of sales. Start here. Leaders run 31.4% across meat, deli, bakery and seafood, plus 11.5% in produce. Break yours down and find the department furthest behind.
- Total store gross margin. Leaders run 29.0%. The field runs 27.9%. A point of margin is real money on grocery volume.
- Shrink rose from 3.5% to 3.9% of sales, against average net profit of 2.20%. For every dollar through the register, 3.9 cents disappears to shrink and 2.2 cents lands as profit. Deli hit 6.8%, bakery 7.3% and produce 6.2%, so the perimeter is your biggest opportunity and your biggest leak at once. More on tracking shrink by department.
- Inventory turns. Total store turns fell to 16.1 from 17.8, the lowest in several years. Slower turns mean cash tied up and fresh product sitting longer than it should.
The operators in that top quartile are not checking these once a year when the study comes out. They are watching them by department, weekly.
What the numbers are actually telling you
Heading into Q4, the study is a benchmark, not a verdict. Twelve times the profit sounds like a different league. It is not. It is 2.5 points of gross margin, nearly nine cents more of every dollar coming from fresh, and a habit of looking at both more than once a quarter.
Profit leaders are not running a different business. They are running a different mix and measuring it more often.
Pull your four numbers. Compare them to the leaders. Start at the perimeter.
The tools behind the numbers
Closing the gap takes visibility you can act on week to week.
Profit Hound™ puts your department-level performance in front of you on a current basis, benchmarked against the same data behind this report. Instead of learning in October how the first half went, you see margin, shrink and turns while there is still quarter left to fix them.
Track-It™ goes after the loss itself. Track shrink by department, item and reason, print markdown labels with rules set by department, UPC or PLU, and record losses directly into your financial system. Formerly GOT Systems, Track-It is built for exactly the fresh departments where the numbers show shrink running highest.
Free Resource
See where your store lands
Request the full 2026 U.S. Independent Grocers Financial Study and benchmark your departments against the profit leaders.
About the author

Rachael Gideo is the Senior Director of Solutions Engineering at FMS Solutions, where she leverages over 13 years of accounting experience to drive strategic innovation and operational excellence. She holds a Master of Accounting from the University of Alabama at Birmingham and has built a diverse career spanning multiple industries, with a specialized focus on grocery retail over the past six years. Rachael’s expertise encompasses traditional accounting, budgeting, and advanced analytical solutions, making her a trusted leader in financial strategy and performance optimization.
