
Grocery stores remain the preferred destination for frozen foods and refrigerated dairy, but shoppers want those aisles to deliver more value, broader variety and easier navigation, according to new research from Acosta Group. The findings, drawn from the company’s proprietary Shopper Community, were presented at the National Frozen & Refrigerated Foods Association convention in October.
The study surveyed 1,183 frozen foods shoppers Aug. 14-19 to map how they navigate frozen and refrigerated categories, including purchase drivers, retailer preferences, perceptions and unmet needs. Kathy Risch, SVP of shopper insights and thought leadership at Acosta Group, presented the results.
Key findings
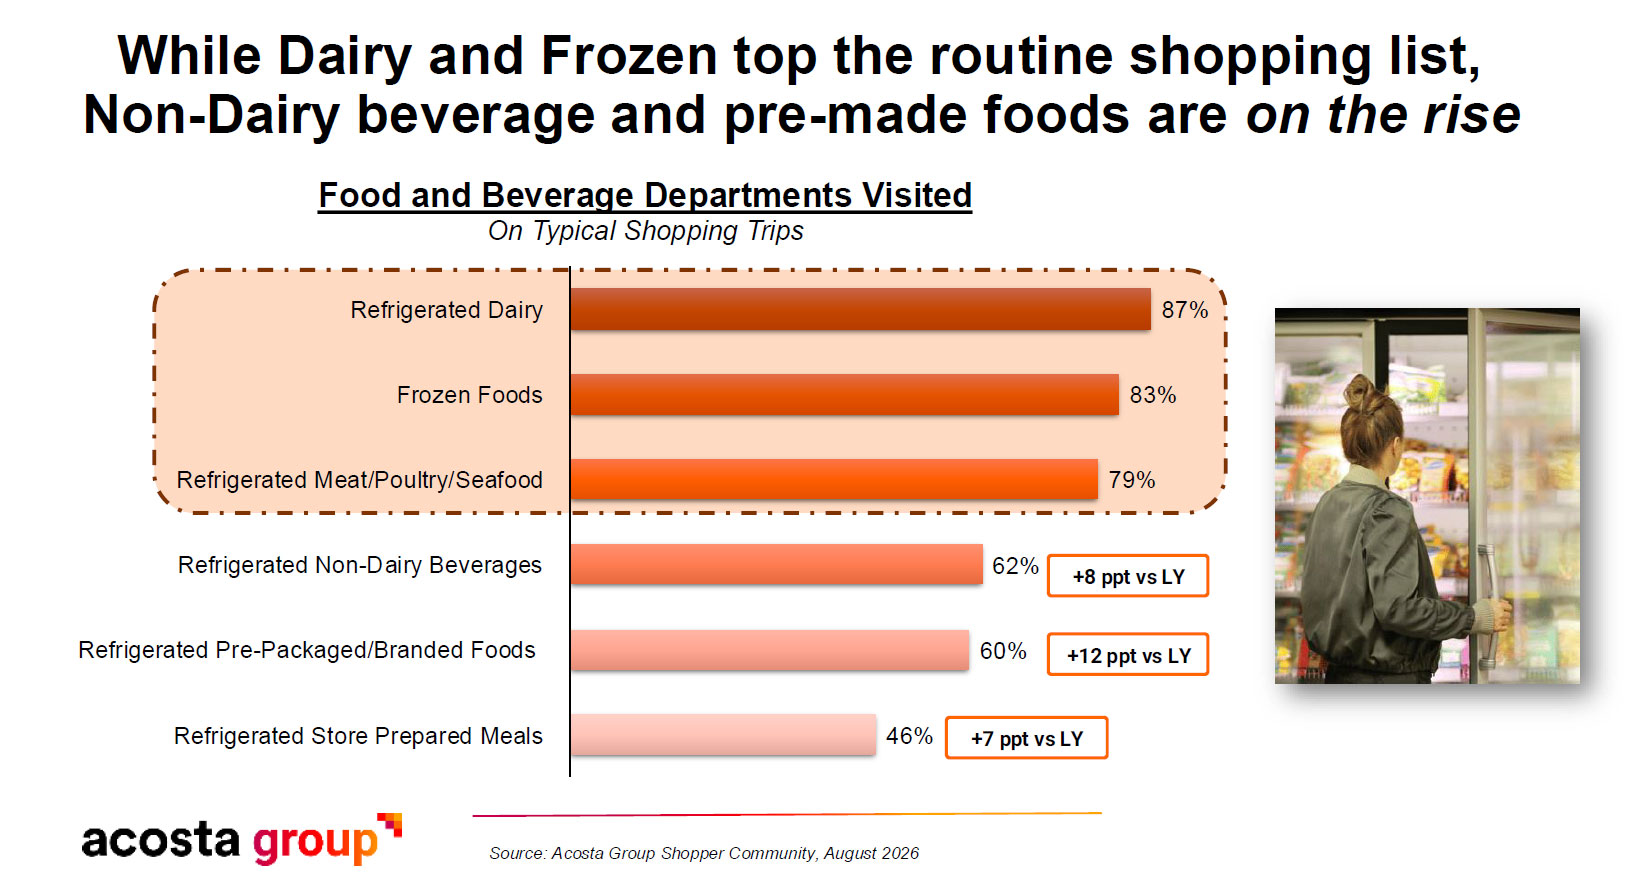
- Refrigerated dairy (87 percent), frozen foods (83 percent) and refrigerated meat, poultry and seafood (79 percent) are the most visited food departments on a typical trip. Refrigerated non-dairy beverages (62 percent) and refrigerated pre-packaged branded foods (60 percent) gained 8 and 12 points, respectively, from last year, and refrigerated store-prepared meals (46 percent) gained 7 points.
- Omnichannel shoppers do 73 percent of their frozen foods shopping in physical stores, compared with 67 percent of all grocery shopping, among 559 respondents who shop both online and in store.
- Grocery stores were named the best place to buy frozen foods by 51 percent of shoppers, ahead of mass merchandisers (32 percent) and warehouse clubs (11 percent). For refrigerated dairy, grocery led at 56 percent, followed by mass (30 percent) and club (6 percent). Shoppers credited grocery with variety and brand selection, mass with price and store brands, and club with bulk buying.
- Shoppers describe frozen foods as budget-friendly (76 percent), convenient to store (75 percent), good for quick meals (70 percent), varied (69 percent) and easy to prepare (65 percent). Refrigerated foods are seen as fresh (78 percent), premium (70 percent), good for health goals (67 percent), high quality (67 percent) and good for special occasions (61 percent).
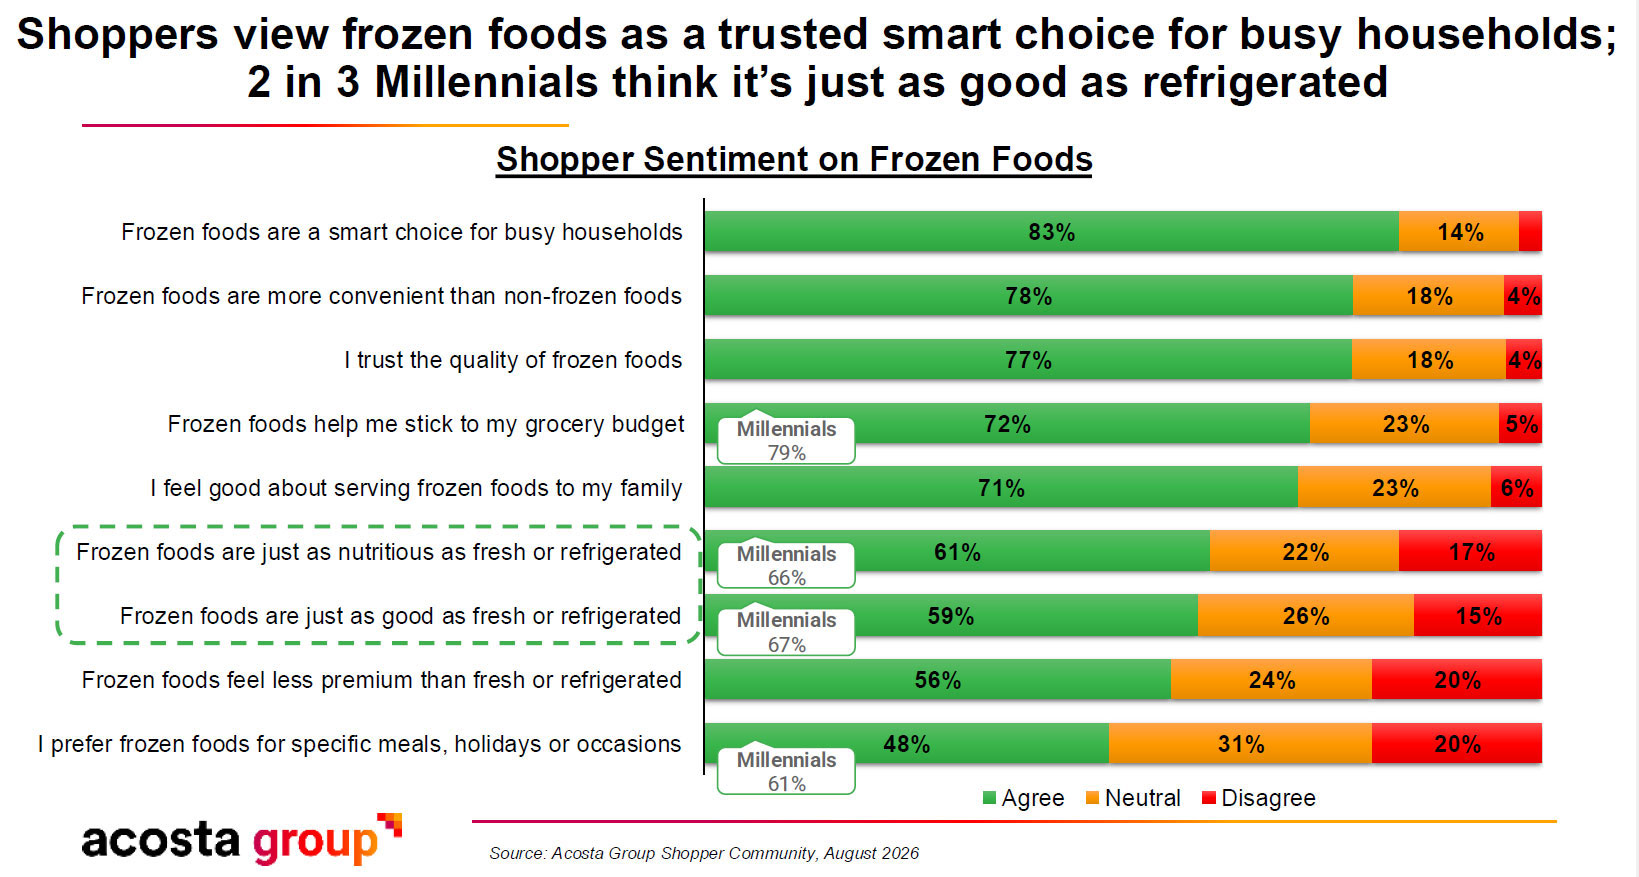
- 83 percent agree frozen foods are a smart choice for busy households, 78 percent say they are more convenient than non-frozen foods and 77 percent trust their quality. Seventy-two percent say frozen helps them stick to a grocery budget.
- Perception gaps remain. Sixty-one percent say frozen is just as nutritious as fresh or refrigerated, and 59 percent say it is just as good, with Millennials higher at 66 and 67 percent. At the same time, 56 percent say frozen feels less premium.
- Compared directly with fresh, frozen wins on convenience (79 percent better) and value (59 percent better) but splits on taste (29 percent better, 24 percent worse) and nutrition (27 percent better, 23 percent worse). The share rating frozen worse on nutrition fell 6 points from last year.
Food trends shoppers want in the freezer case
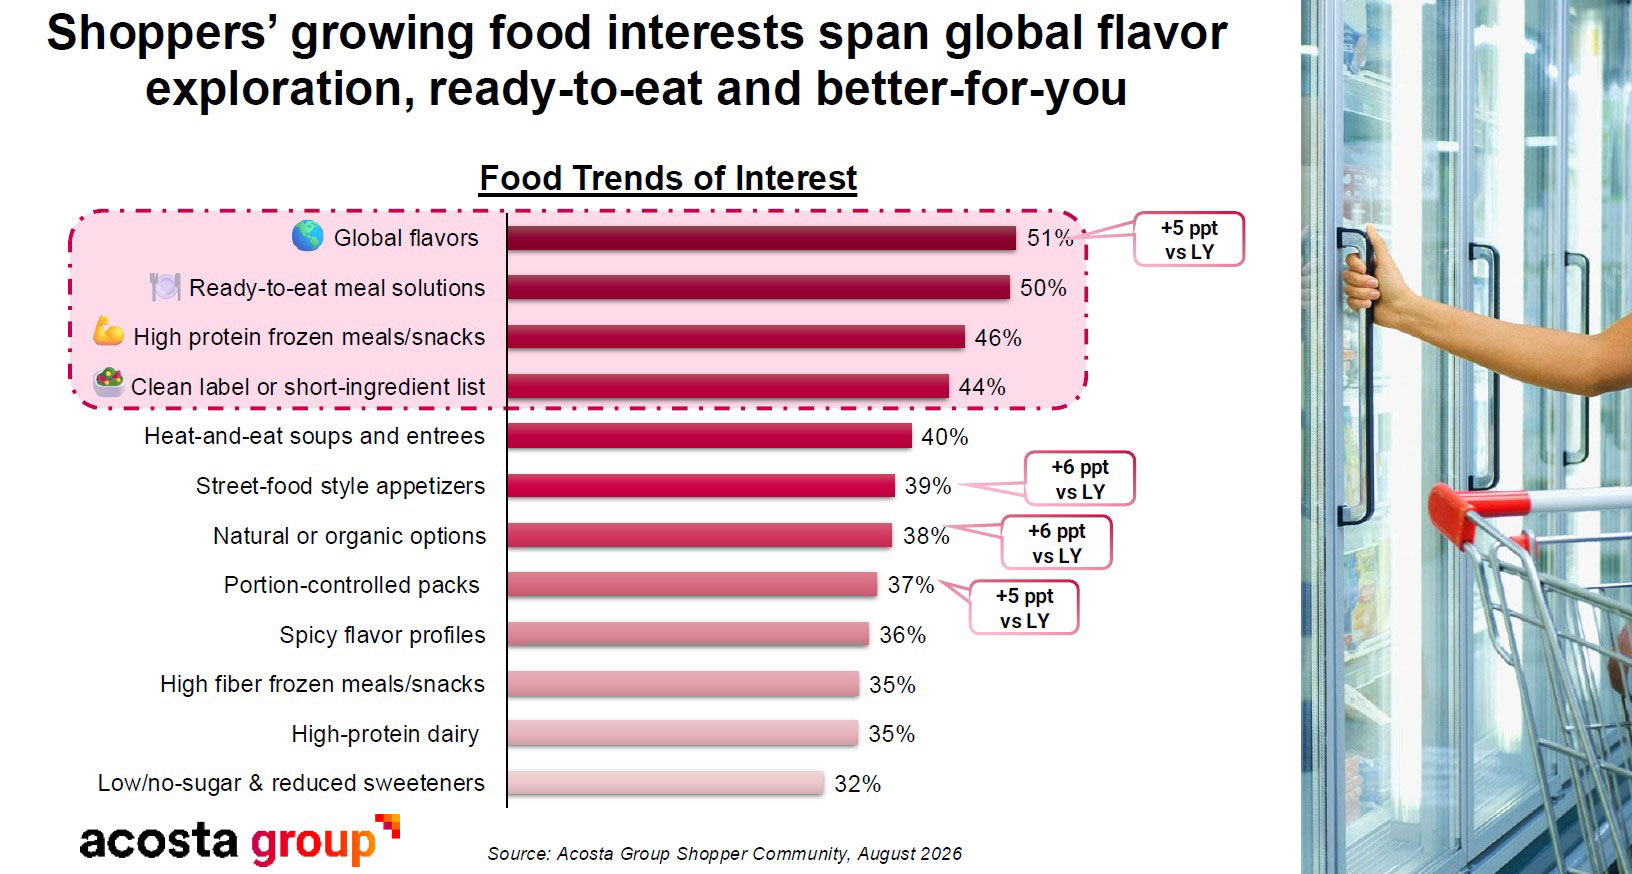
Interest is growing in global flavors (51 percent, up 5 points from last year), ready-to-eat meal solutions (50 percent), high-protein frozen meals and snacks (46 percent) and clean-label or short-ingredient products (44 percent). Street-food style appetizers (39 percent) and natural or organic options (38 percent) each gained 6 points, and portion-controlled packs (37 percent) gained 5.
Asked what would make them shop the frozen section more often, respondents most often cited lower prices and more promotions, healthier options, a larger assortment and clearer organization. Several asked for clearer shelf tags placed directly above sale items, labels on freezer doors that call out dietary needs and protein content, and sections sorted by meal type. Other requests included better lighting, doors that do not fog over, weekly samples and a kid-friendly subsection for busy parents.
Gen Z shoppers lean on convenience
Among the 302 Gen Z respondents, 59 percent are interested in ready-to-eat meal solutions and 52 percent in high-protein frozen items – both above the total sample. Gen Z shoppers also are more likely to rate frozen better than fresh on taste (46 percent) and nutrition (42 percent).
In frozen, Gen Z overindexes on snacks (73 percent typically purchase, versus 63 percent overall), dairy alternatives (37 percent versus 25 percent) and smoothies (29 percent versus 19 percent). In refrigerated, they reach for fresh-cut fruit (61 percent versus 50 percent), prepared meals (58 percent versus 48 percent) and snack kits (50 percent versus 39 percent).
What Acosta recommends
The report frames frozen and refrigerated as complementary rather than competing categories and outlines three opportunities for retailers and brands:
- Position frozen as a complete meal solution through cross-merchandising, meal kits and displays that connect frozen items to refrigerated or fresh complements.
- Reinforce the quality credentials of frozen foods by highlighting real ingredients and nutritional benefits on packaging, in recipes, in retailer circulars and on social media.
- Lean into high-protein, clean-label and globally inspired offerings while reinforcing value through promotions and assortment.
Acosta Group’s Shopper Community includes more than 40,000 U.S. household shoppers who provide feedback on their shopping and consumption behaviors.