
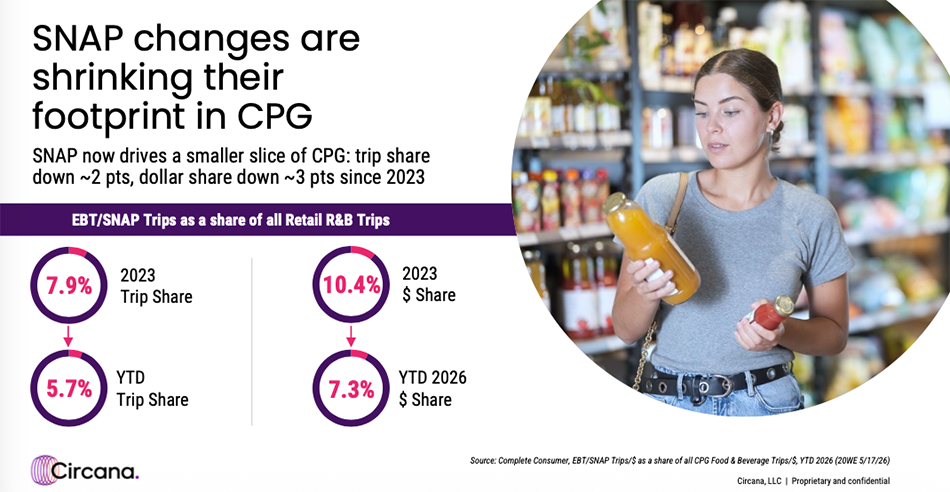
Sweeping changes to the Supplemental Nutrition Assistance Program are expected to reduce EBT funding by about $10 billion in 2026 compared with 2025 and are pushing remaining recipients toward fresher, more deliberate baskets, according to a Circana webinar that examined the program’s first-half impact on consumer packaged goods.
Circana hosted “SNAP in Transition” July 22 to walk retailers and manufacturers through participation declines, category shifts and retailer responses. Sally Lyons Wyatt, Circana global EVP and chief advisor for consumer goods and foodservice, led the session with Daniel “DJ” Joyner, a Complete Consumer consultant at the firm.
“Our goal today is really simple: to give you a clear, data-grounded picture of where SNAP stands now and what to do about it,” Lyons Wyatt said.
Three policy shifts
Lyons Wyatt outlined three developments that shaped the first half. State waivers rolled out early in the year, with multiple states launching USDA-approved pilots restricting benefits from purchasing categories such as soda, candy and energy drinks on a phased basis.
Federal changes followed, including tougher work requirements that raised the age cutoff to 64; limits on benefit growth; and the elimination of SNAP-Ed, a budget/nutrition/health education program for benefits recipients. A June court ruling then struck down waivers in five states, halting bans on soda and candy and casting uncertainty over others.
The most significant effect has been a decline in participation, which accelerated in the spring following full enforcement of the new requirements.
“Fewer participating households mean fewer SNAP dollars flowing through the market, and we estimate roughly $10 billion reduction in EBT funds in 2026 versus ’25, creating pressure on food and beverage categories,” Lyons Wyatt said.
Participation fell to about 12.5 percent of households in the first quarter, down about 1.6 points and representing a drop of about 2 million households, or roughly 11 percent, year over year.
Baskets with SNAP EBT dollars now account for about 7 percent of total retail food and beverage dollars, a shift of about three points versus 2023. Dollar share fell from about 10.4 percent to 7.3 percent, and trip share dropped from about 8 percent to under 6 percent.
“It’s not just that fewer households are on SNAP,” Lyons Wyatt said. “The program is a materially smaller driver of total retail food and beverage than it was two years ago.”
A tighter, more intentional basket
While participation declined, SNAP households spent an average of 1.1 percent more per household versus a year ago on CPG food and beverage in the first quarter – slower than the 4.3 percent growth among non-SNAP households.
Circana put SNAP households’ aggregate Q1 CPG and grocery spending at about $43 billion, down about $4.6 billion year over year, a decline the firm attributed to the smaller participating population. 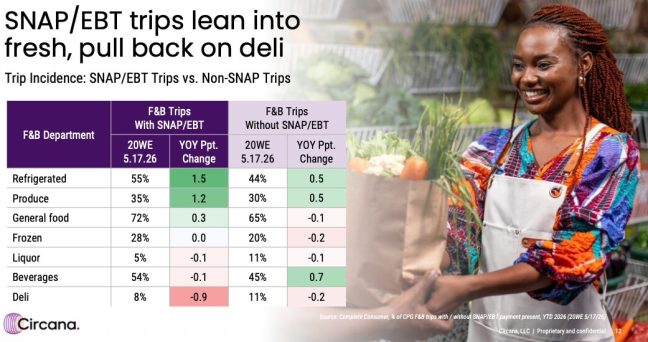
Joyner said SNAP trips leaned further into fresh foods and meal-building basics while pulling back on prepared and convenience options. The refrigerated and produce departments grew as a share of SNAP trips, while deli declined. Fresh vegetables, refrigerated meats, fresh fruit and dairy all appeared more frequently, each growing faster than on non-SNAP trips.
“These households are becoming more deliberate about where those limited dollars can deliver the most value to their families,” Joyner said.
Lyons Wyatt noted that other payment types largely absorbed the pullback. Across waivered and other SNAP-heavy categories such as candy, salty snacks, crackers and cookies, non-SNAP payment growth stayed positive even as SNAP-present EBT dollars fell, in some cases by double digits, keeping total category growth positive.
Waiver categories tell consistent story
Awareness of the changes ran high, particularly among those affected. More than eight in 10 consumers who used SNAP within the past month said they were aware of the new restrictions when surveyed in April, compared with about six in 10 among those who had never used the program.
The clearest behavioral signal came in waiver states. For carbonated soft drinks – restricted in eight states and covering about 1.14 million households – the share of SNAP/EBT trips including the category fell nine percentage points year over year in waiver states, while remaining relatively flat elsewhere.
First-quarter soda spending among SNAP households in waiver states declined 8 percent, falling from $159 to $146 per household, even as non-waiver states saw about a 4 percent increase.
Of the $13 shifted away from soda in waiver states, 81 percent moved into food rather than alternative beverages, led by general food and frozen, with about a quarter going toward protein-rich options and roughly 10 percent toward fresh produce.
“These restrictions aren’t just taking an item from a basket, they’re reshaping spending patterns overall,” Joyner said.
Candy, restricted in five states and affecting about 877,000 households, followed suit. Candy trip incidence dropped 6.3 points in waiver states, from about 22.5 percent to 16.2 percent, while non-waiver states edged up 0.2 points. Waiver-state households spent about $1 less on candy, down about 1 percent, while non-waiver households spent $12 more, up about 11 percent.
Energy drinks, restricted in just two states covering about 335,000 households, behaved differently. Nearly 40 percent of SNAP recipients said they don’t buy the category at all. Trip incidence in waiver states fell from 10.2 percent to 5.4 percent, but spending still grew 7 percent in waiver states – far behind the 39 percent growth in non-waiver states.
Lyons Wyatt cautioned that the analysis reflects a Q1 snapshot and that the mix of states and implementation timing varied.
Tenure, at-home behavior and channels
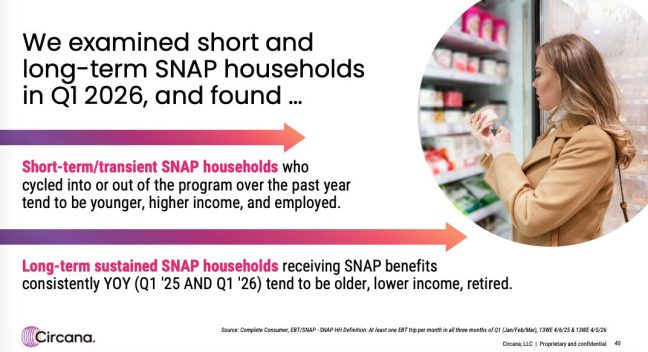 New and sustained SNAP households increased spending faster than non-SNAP households, with new entrants ramping fastest in baby food, frozen and prepared categories. Lapsed households pulled back across the board, hardest on baby food, fresh vegetables and juices.
At home, SNAP consumers over-indexed on heat-and-eat foods, which made up 23 percent of their retail-sourced foods versus 18 percent for non-SNAP consumers, led by frozen pizza, single-serve frozen meals and frozen fries. Sixty-one percent said they often run out of money before payday.
Pure-play e-commerce was the one channel where SNAP outpaced non-SNAP, with spending growing more than 31 percent – nearly twice the non-SNAP rate – aided by platforms such as Amazon. Mass retailers drew the strongest over-index on SNAP trips, followed by dollar stores.
Retailer activations, winning actions
Lyons Wyatt said retailers are moving beyond just accepting SNAP toward affordability, convenience and digital support.
Kroger launched its Verified Savings Program in early 2026, offering SNAP, WIC and Medicaid recipients 20 percent off fresh produce and 50 percent off Boost membership after verification.
Walmart continues to promote Walmart+ Assist at half-price membership, Albertsons uses its “for U” loyalty program, while Target offers a dedicated SNAP EBT online payment experience.
Retailers also are embedding nutrition education through tools such as Walmart’s Easy & Affordable Recipes, Kroger’s OptUP Your Nutrition and Albertsons’ Sincerely Health platform.
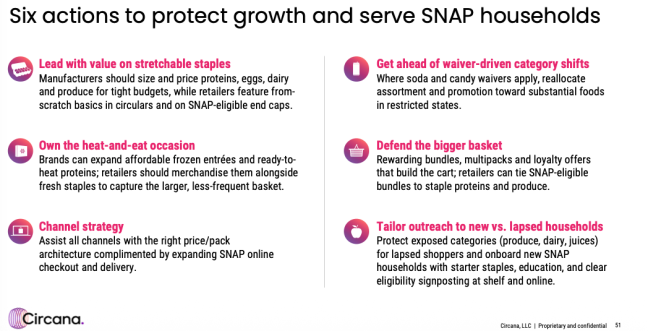 Circana closed with six recommended actions for retailers: lead with value on stretchable staples; get ahead of waiver-driven category shifts; own the heat-and-eat occasion; defend the bigger basket through bundles, multipacks and loyalty offers; get the channel strategy right; and tailor outreach to new versus lapsed SNAP households.
Lyons Wyatt urged the industry to build 2027 plans around a smaller, lower-benefit SNAP population.
“This is really the new baseline, and it’s not a temporary dip,” she said.