Even with inflation and price increases, consumers still are focused on food and beverages, including confections. In an Aug. 23 webinar presented by Snack Food & Wholesale Bakery, Dan Sadler, principle of client insights at market research firm Circana, took a deeper look into the confections industry.
Looking at dollar sales percent change versus a year ago, the food and beverage industry experienced about 6 percent growth, with units down about 3 percent. Looking specifically at candy, which is the No. 4 aisle in retail stores, growth was up more than 12 percent.
For the total confections category, Sadler said “dollars have been really positive throughout all the years.” He noted there were some challenges during the COVID-19 pandemic, with consumers working from home, but overall confections has “been growing pretty well.”
Coming out of COVID, there was growth in unit sales, as consumers were getting back into stores. However, Sadler noted that units were down 4.5 percent in the last quarter, which was the biggest decline since the first quarter of 2022.
“I think we’re starting to see consumers are feeling it a little bit with some of the inflation, some of the price increases and they’re making some choices, whether it’s shift to smaller sizes, larger sizes. But again, we are seeing a little bit of softness in the units.”
The top five manufacturers, representing more than 75 percent of confection sales, have seen double-digit growth over three quarters, although units are down 4 percent. Sadler said manufacturers outside the top five, representing 21 percent of sales, reported dollar sales up 15 percent and units up about 1 percent. Private brands, with 3 percent of sales, had an 11 percent increase in dollar sales and a 6 percent decrease in units.
Breaking down the category further, Sadler looked at the four segments within candy – chocolate, non-chocolate, gum and breath fresheners. 
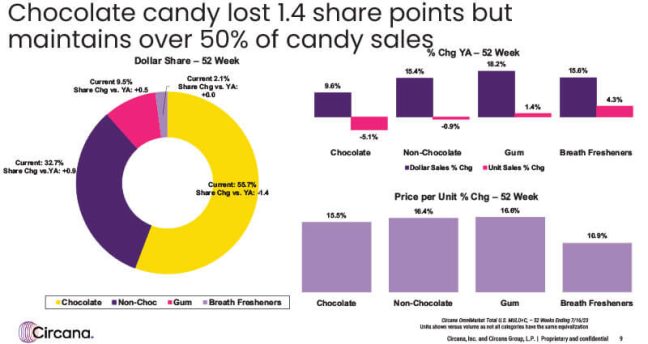
While chocolate candy lost 1.4 share points versus a year ago, it makes up 55.7 percent of total candy sales, with non-chocolate at nearly 33 percent.
“So, roughly, non-chocolate and chocolate candy make up about 90 percent of confection sales.”
Sadler noted while there is softness for chocolate and non-chocolate, the gum and breath freshener categories are seeing “some good growth.” He pointed to double-digit price increases across all the different categories.
Nearly every household in the U.S., 98 percent, is buying some sort of candy at least once a year. Of those, nearly all of them, 97 percent, make a repeat purchase. These consumers are making about 35 trips per year, which is up 1 percent versus a year ago. Their annual spend on candy is about $250.
Total basket ring, when they are in the store buying candy, is about $73 per trip, which is 26 percent higher than the average food and beverage rings, Sadler said.
“When consumers are buying candy, you’re seeing a higher ring consumer. They’re bringing in incremental dollars.”
While individual candy segments lost buyers, the category overall lost just 85,000 buyers.
Sadler noted that indicates that consumers are cross purchasing between the different categories. Of the 98 percent of households buying candy, about 9 percent are exclusive to chocolate and 2 percent are exclusive to non-chocolate purchases.
This presents an opportunity for retailers to convert about 14 million households. “If we were to get these exclusive households to cross purchase instead of buying just chocolate, maybe just one more trip and buy non-chocolate…it’s an $80 million opportunity.”
Inflation’s impact to confections
Inflation is starting to abate, with the perimeter of the store softening faster than center store. However, prices remain above 2019 levels.
“At the end of the day, everyone has taken a price hit since COVID,” Sadler said.
In addition to inflation, other factors impacting prices include rising consumer credit, increasing interest rates, household debt is climbing along with the cost of housing. He noted that earlier this year, the emergency increase in SNAP benefits ended.
Inflation within confections is still occurring, with double-digit price increases throughout the year. Sadler said they are seeing more than 10 percent price increases across the categories. He also said confections tends to be inflation/recession-proof, “and we’re seeing that here.”
Sadler also looked at promotion price sensitivity. He said chocolate candy gets about 16 percent lift when on promotion.
“You don’t get a real strong response with the base price, but you get a really good response when you’re on promotion.”
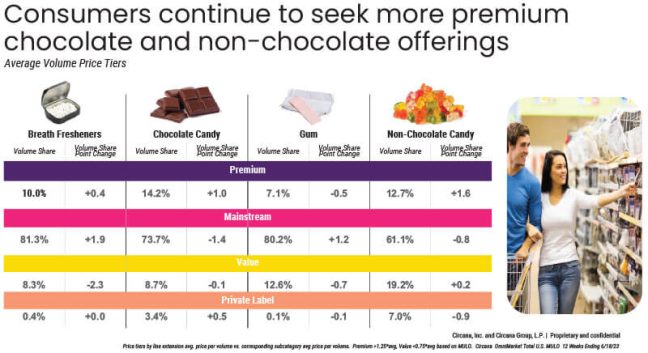
Price tiers offer a bit of a different look. Premium confections are priced 25 percent higher than the category average, value products are priced 25 percent below category average, mainstream is in between and private label is the last tier.
Looking at volume share over the last 12 weeks for breath fresheners, more than 81 percent is mainstream. Volume has increased nearly two points versus a year ago. Chocolate is up 14.2 percent in premium volume share, with an increase of one point. Sadler said private label also has seen some share increases.
In the gum category, 80 percent of sales are mainstream, which is an increase over a year ago. In non-chocolate, premium volume share increased 12.7 percent, up 1.6 points. Novelty products are driving some of the non-chocolate premium increases.
Channel landscape
Dollar growth is strong across all channels, driven by higher prices, Sadler said. Confections is about a $36 billion industry, with 75 percent of all confection sales going through food, mass and convenience channels.
He said dollar sales are up across all channels, but the only one seeing unit growth is online.
While there is a slight uptick in trips, trends vary across the different channels.
Sadler then looked across all outlets in the U.S. by generations and how well they index for candy. While Millennials make up about 29 percent of the population, they account for just 23 percent of candy sales. Gen X and Boomers are engaged with confections, however, their channel preferences are much different.
While Gen X buys a lot of candy in the mass outlet, they also are buying in convenience. Boomers buy more in the food, drug and club outlets. While under-indexed overall, Millennials buy most of their candy in convenience outlets.
Online was the one channel recording dollar and unit growth. It represents about 7 percent of candy sales but posted a little more than 10 percent of the growth.
In online dollars, chocolate is down in share and unit sales versus a year ago, but it is up 14.6 percent in dollar sales. Non-chocolate was up 21.6 percent in dollar sales and saw an 8.8 percent increase in units. Gum was up 35.1 percent online versus a year ago, with units up 16.9 percent. Breath fresheners posted a 26.9 percent increase in dollar sales and up 32.2 percent in units.
Sadler said 90 percent of all online transactions are through store pickup or delivery (up 25.3 percent) or online sites such as Amazon (22 percent increase).
One way to grow the confections category is to meet the needs of what Sadler termed “e-shopping enthusiasts.” This segment of online shopper has an average age of 34, a median income of $57,000 and is more likely to have children than other e-commerce segments. It also has the highest penetration of five-plus member households and is the most racially diverse segment.
This segment is becoming more engaged with candy, with gain seen in chocolate.
Product trends and innovation
While chocolate candy remains popular, novelty non-chocolate has seen double-digit dollar and unit growth. Novelty products include Bazooka brand portfolio products, ropes candy and other unique products.
The category is up 44 percent in dollars and up 26 percent in units. Sadler noted that novelty products are premium priced.
Convenience stores do a lot of business in novelty, with 29 percent of such sales coming from that class of trade, which contributes about 43 percent of the growth.
Sadler said four million more households purchasing novelty candy over the last 52 weeks. Total basket ring also is higher with these items.
“Novelty consumers are definitely a high-rate consumer that bring in more incremental dollars to the shopping basket.”
 Sadler noted another trend is a slight increase in volume versus a year ago in premium chocolate candy, 3.1 percent, and a larger increase in private label, 14.5 percent.
“Consumers were treating themselves a little bit more, they’re indulging a little bit more and it’s really a trend that hasn’t gone away. It’s kind of really stuck after COVID,” Sadler said of the premium increase.
In private label, consumers are wanting to treat themselves but are trading down a little in price.
In better for you trends, there has been some softness in organic and non-GMO in dollar sales percent change versus a year ago. However, there has been good growth in no-sugar and low-sugar products, along with vegan options.
“As we compare this to some of the other better for you claims in general across the store, from a low-sugar perspective, non-dairy and natural, we’re actually trending ahead of some of the total store claims.”
According to Sadler, there is positive growth to be had in better for you confections. He also noted the growth in gum and breath fresheners, which he attributed to households raising teens and people getting out more post-COVID.
“We’re seeing dollar sales up over 18 percent, unit sales up almost 1.5 percent. And they’re doing this despite fewer items on the shelf,” he said of the gum category.
Breath fresheners showed dollar sales up 16 percent and units up 4 percent, despite having 7 percent fewer items on the shelf.
“It’s a really good story for gum and breath fresheners. They’re losing shelf space, but they’re growing dollars and units.”
Looking at innovation in the industry, Sadler said it is coming back after slowing in the past three years. During the pandemic, manufacturers were more focused on supply chain than innovation.
Consumers continue to look for new textures, flavors and combinations. He noted Feastables’ Mr. Beast candy bar, which launched in September 2022 and has about 16 million in sales in a little less than 52 weeks. “It’s a really good success story from a new product standpoint.”
Big four seasons
The four key seasons – Halloween, winter holiday, Valentine and Easter – account for two-thirds of chocolate and non-chocolate candy sales.
Sadler said looking at total chocolate and non-chocolate, dollars were up double digits across each of the holidays, outside of Easter. Units were slightly down, with a bit more of a decrease during Halloween and Easter.
Dollar gains were boosted by inflation. Non-chocolate Halloween items posted volume and unit growth. Sadler said this may be due to the fact non-chocolate Halloween candy was priced about 25 percent less than chocolate.
Looking at sales by week for the Halloween holiday, he noted they were strong in the early weeks but lagged during the last three weeks. About two million buyers were lost, and gaining them back is an $18 million opportunity.
Winter holiday sales struggled somewhat, as consumers started seeking value, Sadler said. Looking by week, he noted there was a slower turnover of shelves between Halloween and the winter holiday. The first seven weeks were down, but the final week saw a 34 percent increase in volume sales.
He said the majority of lost buyers during the winter holiday were Millennials. If retailers can get them back, it would be a $9 million opportunity.
Looking at exclusivity, Sadler said if the industry can convert consumers who just buy candy during the eight weeks of winter holiday to make one trip outside of that season, it is a $70 million opportunity.
Valentine numbers were strong, with non-chocolate seasonal items leading the way with a 35.7 percent increase in dollars, a 14.4 percent increase in volume and 20.2 percent increase in units.
Looking at sales by week, Sadler said there were some ups and downs in the early part of the year, but “we saw a lot of Valentine candy being purchased during that final week.” He noted there were more Valentine items on the shelves this year compared to last.
Conversation hearts drove non-chocolate growth this year, seeing an increase in share, volume, shelf presence and buyers.
The Easter holiday had a shorter time period this year. While there were dollar gains, units and volume sales were down for the second year in a row. There was some growth in the final weeks leading up to the holiday.
“One of the things we need as an industry is to make sure consumers are engaged early on and keep them engaged throughout that seasonal time period,” Sadler said.
Winning in store
The front end of the store is the ninth biggest category within the grocery outlet, Sadler said. “It drives a lot of business, a lot of volume, and it’s very profitable.”
The front-end shopper shops more often and spends more. A survey of why they are making these purchases received responses including: satisfy hunger, reward myself, treat someone else, try something new.
“These are all right in our confections wheelhouse. All these different attitudes are what confections can really accomplish.”
Sadler also noted the importance of in-store displays for confections. While their numbers had decreased since 2018, they are making a bit of a comeback.
The average store has about 9.4 displays for candy, which is up slightly versus a year ago. When candy is on display, it gets a lift of about 54 points, compared to 31 for total store.
“When candy is on display, you get really strong results.”
Read more snacks news at The Shelby Report.

