Two years after the World Health Organization declared COVID-19 a global pandemic on March 11, 2020, Catalina has continued to monitor its Buyer Intelligence Platform to track the pandemic’s impact on buying behavior at grocery stores across the U.S.
Many categories that experienced high growth during the pandemic’s first year have retreated partially, but remain higher than pre-pandemic levels. Other previously struggling categories have seen modest increases over the past year.
In looking at the past two years of data beginning with the week ending Feb. 15, 2020, shoppers made more trips than average in March 2020 when the pandemic set in, but drastically reduced trips that April as they began sheltering at home.
The impact of lockdowns, masking and social distancing paved the way for a lasting decline in weekly, in-person shopping trips starting in May 2020, compared to the prior year. Catalina reports that the trend continues as guidelines from the Centers for Disease Control continued to shift. While people by and large have been shopping less, they continue to buy more in-store. Spending per trip has increased by 22 percent on average, compared to pre-pandemic levels. Overall, average weekly spending on groceries has increased by 16 percent.
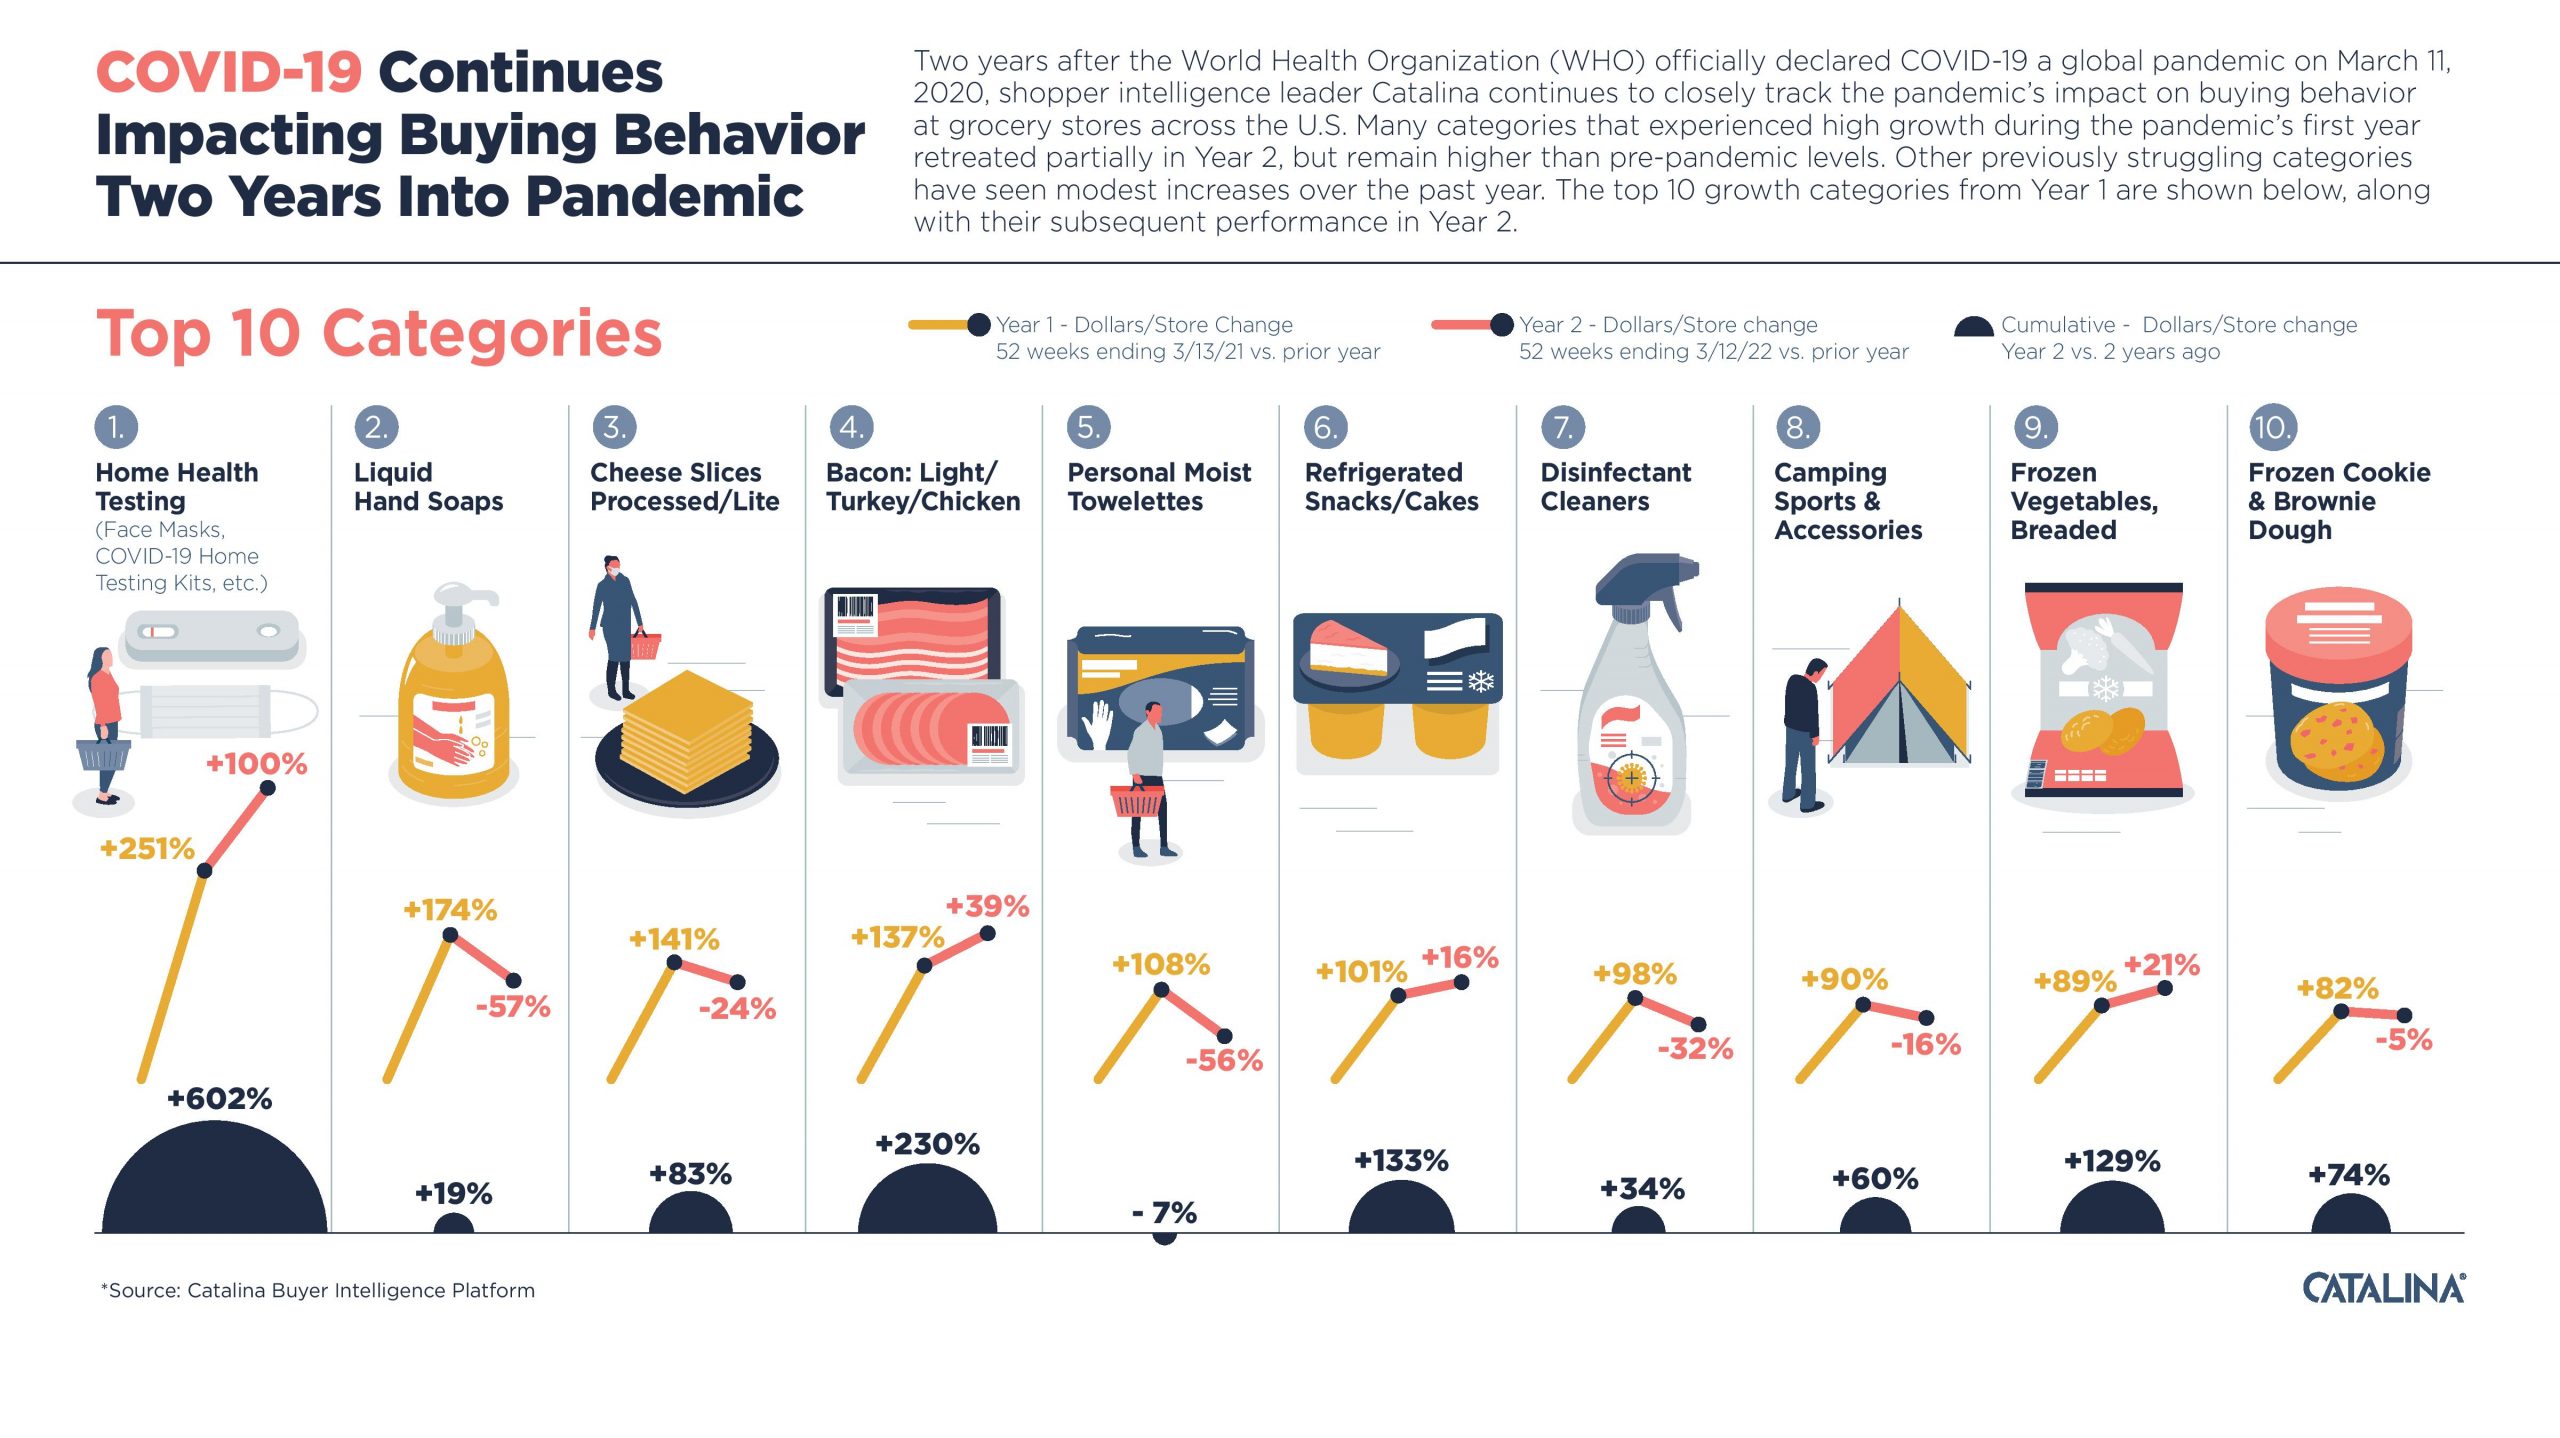
The top 10 categories seeing the greatest sales growth during year one of the pandemic have either seen strong year-over-year increases since 2019 (pre-pandemic) or experienced declines last year. The majority are still above where they were when the pandemic began:

A year ago, face masks accounted for 80 percent of the home health testing category. Its strong sales performance has continued even as masking guidelines established by the CDC have evolved, and COVID-19 home testing kits were launched in April 2021.
The Catalina data also reveals that people by and large are still conscious about fighting germs, just not as much, with sales for liquid hand soaps, personal moist towelettes, and household disinfectants all dropping in 2021, but currently still reflecting higher sales than pre-pandemic levels.
Catalina reports that three of the top 10 categories are foods that continue to show an increased appetite for convenience and/or comfort, including processed cheese slices, bacon, refrigerated cookie and brownie dough, snacks/cakes and frozen breaded vegetables. An outlier includes the camping/sports accessories category, which continues to reflect consumers wanting to spend more time outdoors.
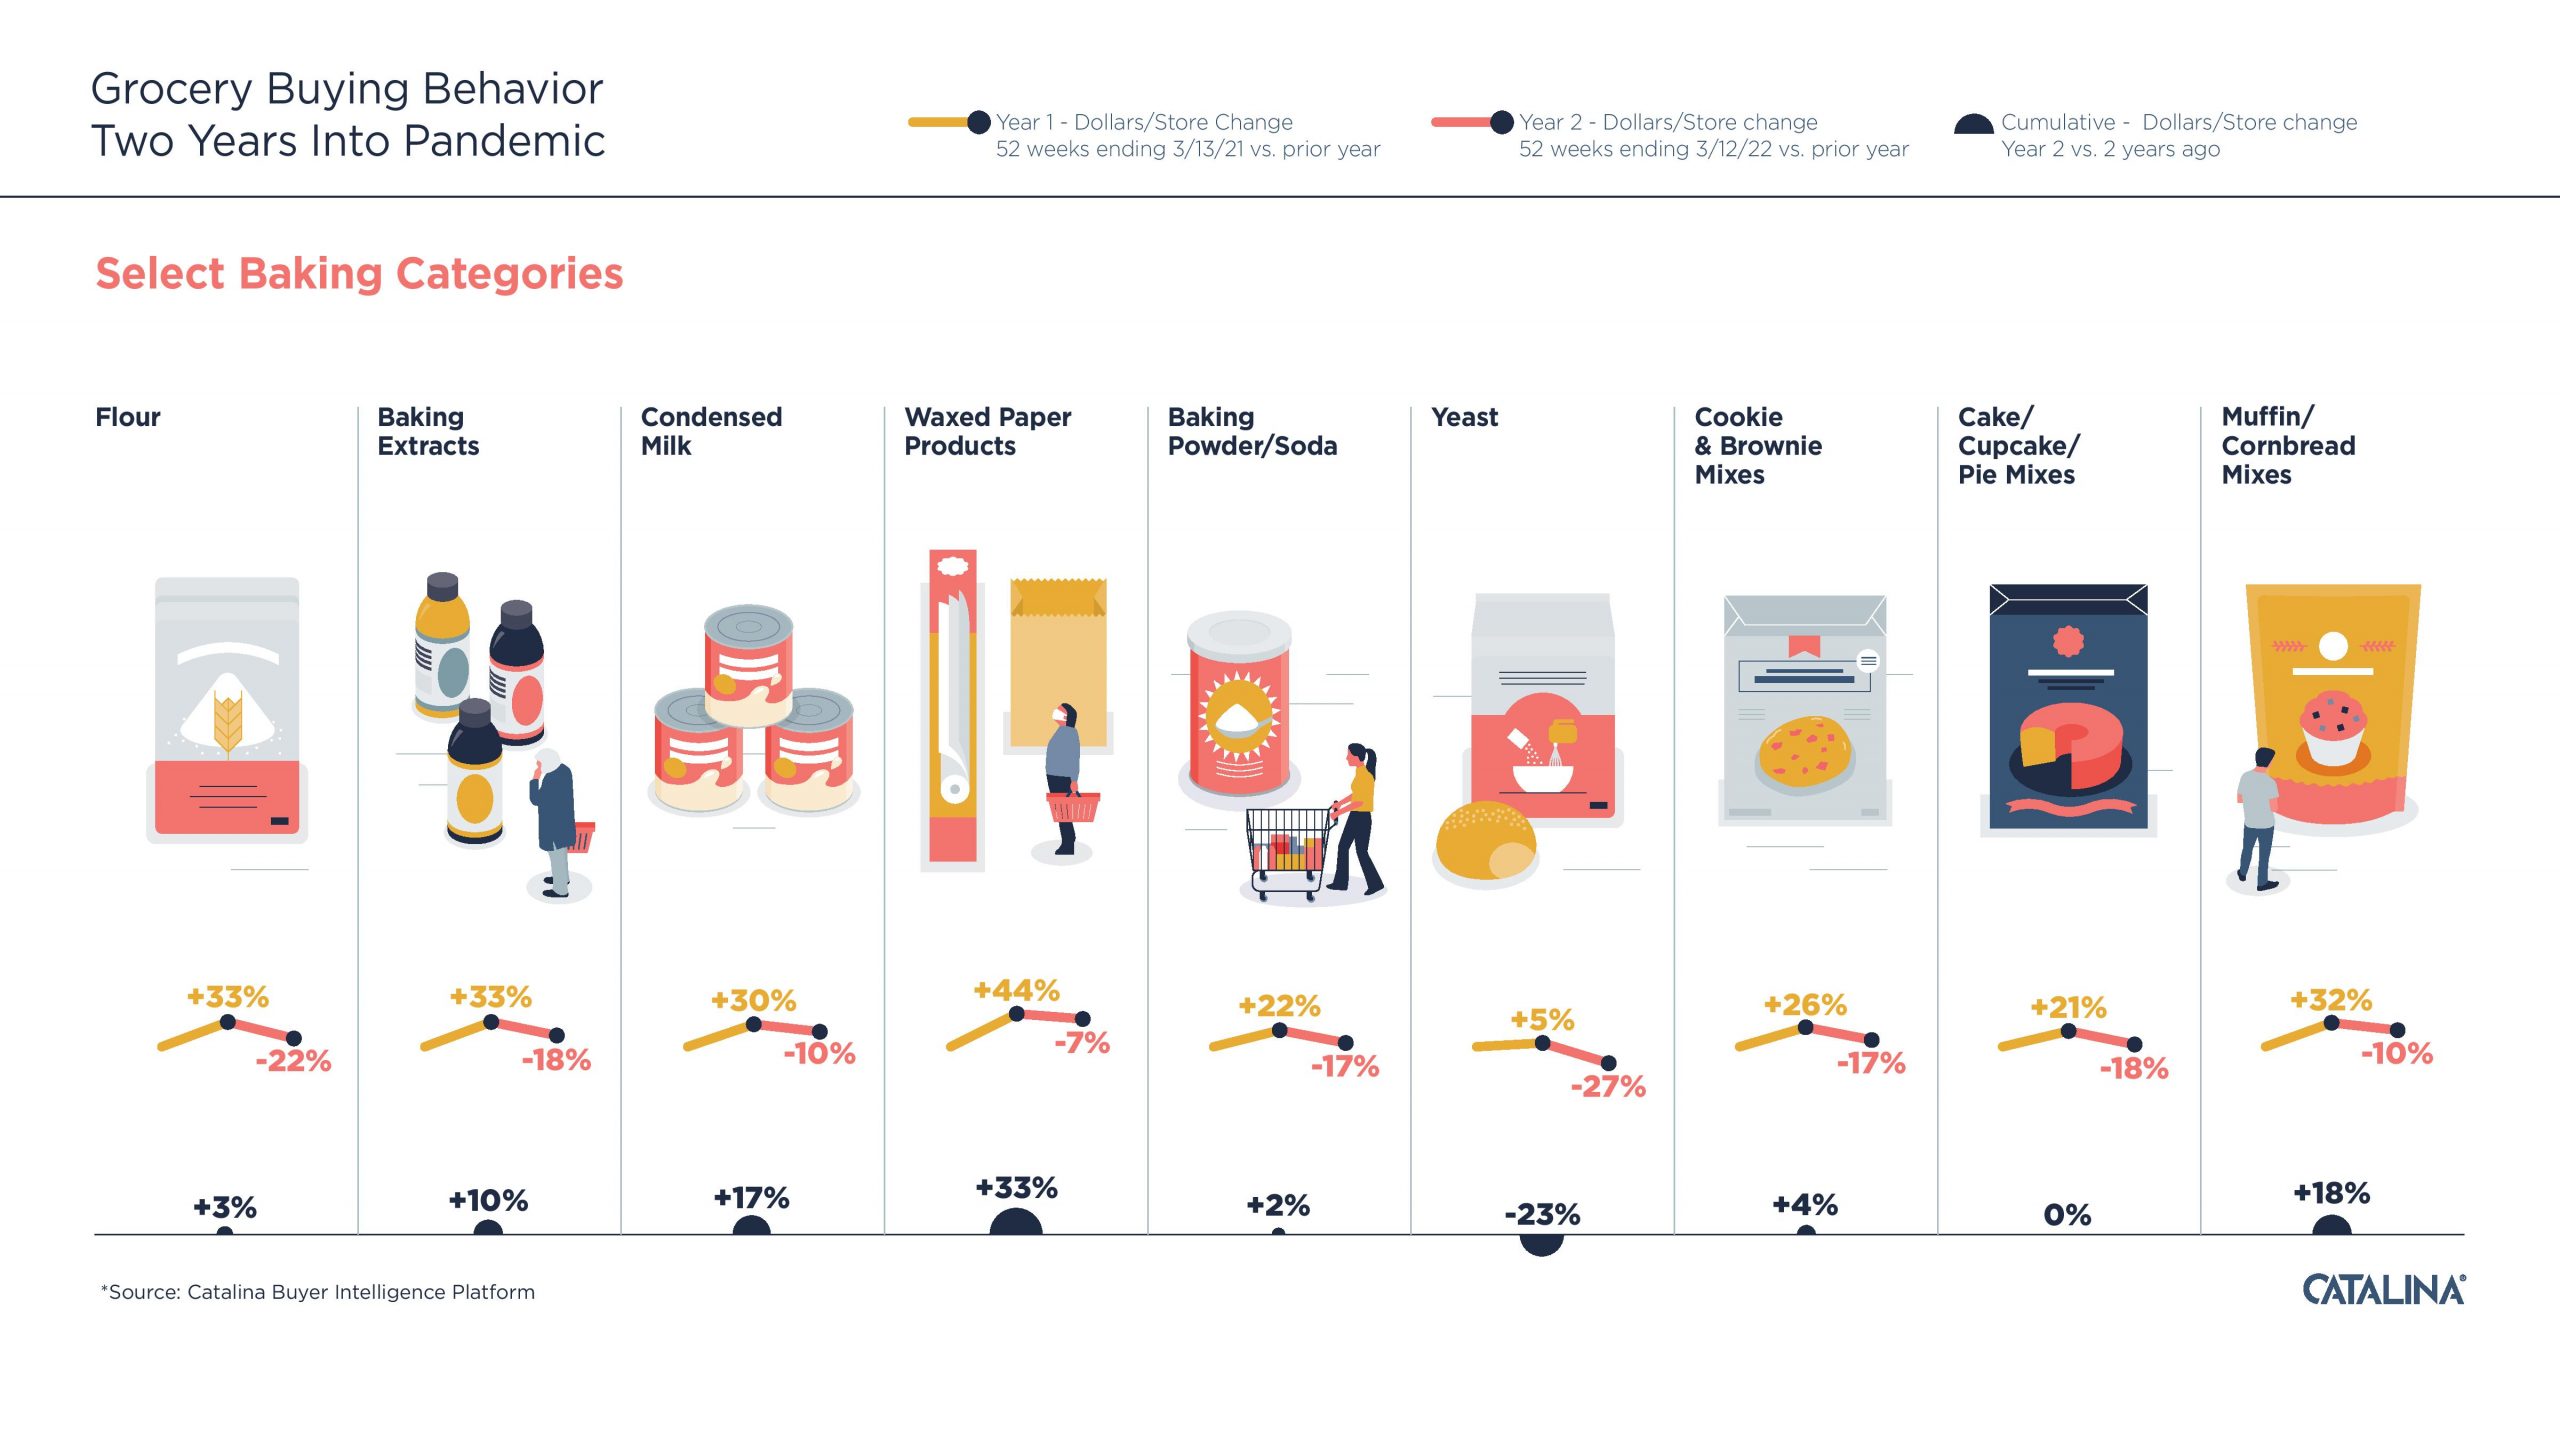
The rise of home baking as a hobby has stuck, though not at the same level as year 1, as categories like flour, condensed milk, baking extracts and waxed paper products have fallen, but are still higher than pre-pandemic levels. Scratch baking may not be quite as popular with yeast sales continuing to decline over the past year, but brownie, cookie and cornbread mixes continue to sell well.

According to Sean Murphy, chief data and analytics officer for Catalina, its data scientist teams rely on the company’s Buyer Intelligence Platform for insights on evolving shopping behavior. “By applying our analytics skills and a combination of Artificial Intelligence and Machine Learning tools to such data, we can more effectively help retailers and CPG brands identify relevant audiences and develop marketing, media and activation strategies that both predict and influence purchase decisions in real time,” Murphy said.
Catalina is a leader in shopper intelligence and highly targeted in-store, TV, radio and digital media that personalizes the shopper journey. It helps retailers, CPG brands and agencies optimize every stage of media planning, execution and measurement to deliver $6.1 billion in consumer value annually.
Catalina has operations in the U.S., Costa Rica, Europe and Japan.
To learn more, visit catalina.com.

