by Anne-Marie Roerink / president, 210 Analytics LLC
The multi-month normalization of grocery shopping patterns came to a halt in August.
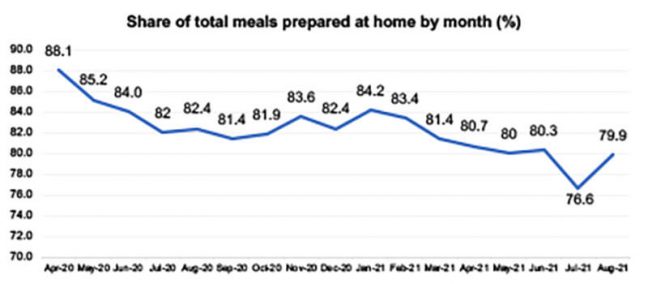
“Since January 2021, we had been seeing the share of meals prepared at home decrease a little each month,” said Jonna Parker, team lead Fresh with IRI. “However, with the elevation of COVID-19 cases in the past month, IRI’s latest survey wave among primary shoppers found that the share of meals prepared at home increased once more to nearly 80 percent from 76.6 percent in July.”
 At the same time, the survey found that people were a little less likely to eat on premise at restaurants. After reaching a high of 50 percent of primary shoppers in July, the share dropped to 48 percent in August. Restaurant takeout remained at its high pandemic levels: 53 percent of consumers have gotten takeout and 20 percent had restaurant food delivered in the past few weeks.
“Additionally, August saw a bit of an uptick in e-commerce orders after several months of trips moving back to in-person visits,” said Parker. “While these are small shifts, online versus in-store trips can mean different items being purchased, with only ground beef and bacon penetrating the top 15 fresh items sold online.”
The survey also found that shoppers continued to spend less time in-store than they did pre-pandemic. IRI and 210 Analytics analyzed the retail meat department performance in the first seven months of the year along with an August performance deep dive. The report is made possible by Marriner Marketing.
Inflation
Meat prices, along with food inflation across the store, remained a big topic of discussion in August. The IRI-measured retail price paid by the shopper shows that prices continued to rise 4 percent-6 percent over and above their elevated 2020 levels for total food and beverages in recent weeks. Meat prices (dollars divided by volume average at retail) had above-average gains in August amid widespread supply tightness. The most recent (July) numbers from the Bureau of Labor Statistics showed record increases for restaurant prices and very similar increases for food-at-home.
| Price index vs. YA | 6/13 | 6/20 | 6/27 | 7/4 | 7/11 | 7/18 | 7/25 | 8/1 | 8/8 | 8/15 | 8/22 | 8/29 |
| Total food and beverages | 102 | 102 | 103 | 103 | 104 | 104 | 104 | 104 | 105 | 105 | 106 | 106 |
| Fresh meat | 96 | 99 | 99 | 100 | 103 | 103 | 104 | 107 | 109 | 108 | 110 | 110 |
Source: IRI, Integrated Fresh Total US, MULO, inflation index vs. YAGO
Price per Volume
Across all measured meat and poultry items in the IRI retail universe, both fixed and random weight, the average price per pound volume paid by the shopper stood at $3.89 in the first quarter of 2021 and rose to $4.08 in the second quarter. The average increased to $4.31 in August 2021. Price increases have affected fresh meat more than processed meat. The 2021 inflation is on top of the increases seen in 2020, leading to double-digit price increases for most areas when compared with 2019.
| Price inflation (price/volume) | Price/volume |
Change vs. 2020 |
Change vs. 2019 |
| Total meat YTD through 8/29/2021 | $4.06 | +4.4 percent | +12.6 percent |
| Total meat August 2021 | $4.31 | +8.9 percent | +17.5 percent |
| Fresh meat YTD through 8/29/2021 | $3.92 | +4.3 percent | +14.0 percent |
| Total meat August 2021 | $4.16 | +10.3 percent | +19.5 percent |
| Processed meat YTD through 8/29/2021 | $4.38 | +4.3 percent | +9.6 percent |
| Total meat August 2021 | $4.66 | +5.9 percent | +13.5 percent |
Source: IRI, Integrated Fresh, Total US, MULO, average price per volume and percent gain versus YA and 2YA
Meat Sales During the First Eight Months of 2021
Year-to-date meat sales are now between 2 and 3 percent behind the record 2020 levels. When compared to the pre-pandemic normal of 2019, sales average between 15 percent and 18 percent above typical levels.
| Meat department —
Year-to-date January through August 2021 |
Dollar sales |
Dollar gains vs. 2020 |
Dollar gains vs. 2019 |
| Total meat department | $54.1B | -3.3 percent | +17.1 percent |
| Fresh meat | $36.2B | -3.8 percent | +18.2 percent |
| Processed meat | $17.9B | -2.2 percent | +15.1 percent |
Source: IRI, Integrated Fresh, Total US, MULO, see end for time period definitions
Importantly, while inflation certainly plays a role, the retail supply chain continues to move more pounds through the system as well. Year-to-date, volume sales were down compared with 2020, but still average 4.1 percent more than in 2019, with above average gains for processed meat, at +5.0 percent.
| Meat department —
Year-to-date January through August 2021 |
Volume (lbs) sales |
Volume gains vs. 2020 |
Volume gains vs. 2019 |
| Total meat department | 13.3B | -7.3 percent | +4.1 percent |
| Fresh meat | 9.2B | -7.8 percent | +3.7 percent |
| Processed meat | 4.1B | -6.2 percent | +5.0 percent |
Source: IRI, Integrated Fresh, Total US, MULO, see end for time period definitions
Week-by-Week August Sales
| Meat department | Dollar sales | Dollar gains vs. 2020 | Dollar gains vs. 2019 |
| August 2021 | $7.78B | +3.6% | +16.6% |
| w.e. 8/1/2021 | $1.52B | +1.4% | +16.8% |
| w.e. 8/8/2021 | $1.60B | +2.9% | +17.3% |
| w.e. 8/15/2021 | $1.59B | +4.0% | +20.2% |
| w.e. 8/22/2021 | $1.56B | +4.7% | +21.7% |
| w.e. 8/29/2021 | $1.52B | +5.0% | +7.8% |
Source: IRI, Integrated Fresh, Total US, MULO, $ sales
Meat department sales were very steady in August 2021. The second and third August weeks were the biggest, but at a minimum of $1.52 billion, meat easily remained the highest selling perishables department. Each week generated higher growth levels than those seen in 2020, with gains accelerating as the month went on.
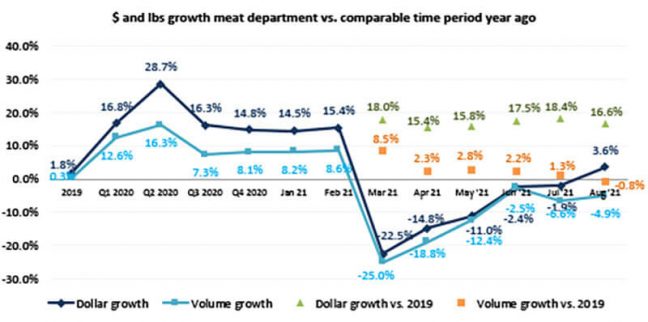
However, despite the increase in home-prepared meals, August ended up being the first month in which volume sales fell below 2020 and 2019 levels, at -0.8%. Volume gains versus 2019 had been trending down since May, but the August decline represents the biggest drop in month-to-month comparisons since March. In July, volume sales versus 2019 were still up 1.3% versus down -0.8% come August.
August year-on-year volume declined for beef, chicken, pork, turkey and lamb but increased for some of the smaller sellers, including veal and exotic meats. On the processed side, year-on-year volume decreased for all areas with the exception of processed chicken.

Source: IRI, Integrated Fresh, MULO, % growth versus year ago
Assortment
The meat department had yet to fully recover from the deep drop in assortment that took place in the early months of the pandemic and with substantial supply chain woes, assortment has dropped down further in recent months. In June, assortment reached 550 fixed and random weight items in the typical meat department. Come August, this is down to 538 items. While still up versus 2020, this is down 18 items versus the 2019 August levels.
| Average meat department items per store selling for week ending… | ||||||||||||
| 2019 | Q1 20 | Q2 20 | Q3 20 | Q4 20 | Q1 ‘21 | Q2 21 | Jun ‘21 | Jul 21 | Aug 21 | |||
| Items | 566 | 560 | 517 | 529 | 546 | 545 | 547 | 550 | 549 | 538 | ||
| Change | -1.0 percent | -1.3 percent | -9.0 percent | -5.8 percent | -3.7 percent | -2.8 percent | +6.2 percent | +8.1 | +5.0 percent | +1.5 percent | ||
Source: IRI, Integrated Fresh, Total US, MULO, average items per store selling
Fresh Meat by Protein – Virtually All Protein Areas Gain
The overall gain in fresh meat was supported by gains in beef, chicken, pork, turkey, lamb and exotics. Only veal sales were down slightly versus 2020 levels. Pork, lamb and exotics generated the highest gains, with fresh lamb sales still sitting 34.2 percent over year-ago levels.
| August 2021 | $ sales gains versus comparable period year ago | |||||||||
| 2019 | Q1 ‘20 | Q2 ‘20 | Q3 ‘20 | Q4 ‘20 | Q1 ‘21 | Q2 ‘21 | Aug ‘21 | Aug vs ‘20 | Aug vs ‘19 | |
| Total fresh meat | +1.7 percent | +16.9 percent | +32.0 percent | +18.0 percent | +15.9 percent | +0.6 percent | -10.9 percent | $5.2B | +3.9 percent | +18.3 percent |
| Fresh beef | +2.2 percent | +18.0 percent | +35.7 percent | +22.6 percent | +18.6 percent | +2.2 percent | -10.7 percent | $2.9B | +3.1 percent | +20.8 percent |
| Fresh chicken | +1.7 percent | +13.9 percent | +23.0 percent | +10.5 percent | +13.4 percent | -1.0 percent | -9.6 percent | $1.3B | +5.2 percent | +14.6 percent |
| Fresh pork | +0.1 percent | +16.5 percent | +33.6 percent | +13.9 percent | +12.3 percent | -2.3 percent | -14.6 percent | $691M | +5.9 percent | +15.5 percent |
| Fresh turkey | -1.2 percent | +17.2 percent | +30.4 percent | +9.1 percent | +9.5 percent | -6.8 percent | -17.3 percent | $179M | +1.4 percent | +9.9 percent |
| Fresh lamb | +2.3 percent | +9.4 percent | +25.3 percent | +30.5 percent | +33.6 percent | +23.4 percent | +1.6 percent | $46M | +5.8 percent | +34.2 percent |
| Fresh exotic | +2.8 percent | +18.6 percent | +47.6 percent | +24.4 percent | +23.2 percent | +4.1 percent | -12.7 percent | $10M | +6.1 percent | +27.6 percent |
| Veal | -8.4 percent | +0.5 percent | +16.6 percent | +15.2 percent | +12.5 percent | +5.4 percent | -2.7 percent | $5M | -2.2 percent | +14.1 percent |
Source: IRI, Integrated Fresh, MULO, percent growth versus year ago
Processed Meat – Bacon Drives Impressive Growth
Processed meat grew over and above the 2020 and 2019 sales levels, driven by robust bacon, packaged lunchmeat, breakfast sausage and processed chicken sales. Bacon and packaged lunchmeat are the two biggest sellers within processed meat and their gains easily offset the declines seen in dinner sausage, hot dogs and breakfast sausage.
| August 2021 | $ sales gains versus comparable period year ago | |||||||||
| 2019 | Q1 ‘20 | Q2 ‘20 | Q3 ‘20 | Q4 ‘20 | Q1 ‘21 | Q2 ‘21 | Aug ‘21 | Aug vs ‘20 | Aug vs ‘19 | |
| Processed meat | +1.9 percent | +16.6 percent | +22.5 percent | +13.0 percent | +12.8 percent | +0.3 percent | -7.1 percent | $2.6B | +3.0 percent | +13.4 percent |
| Bacon | +2.9 percent | +13.9 percent | +33.0 percent | +17.8 percent | +19.0 percent | +7.5 percent | -8.9 percent | $607M | +5.2 percent | +21.2 percent |
| Packaged lunchmeat | -0.6 percent | +13.3 percent | +11.4 percent | +5.4 percent | +9.8 percent | -5.1 percent | -4.4 percent | $576M | +4.3 percent | +8.1 percent |
| Dinner sausage | +2.6 percent | +21.6 percent | +32.2 percent | +15.9 percent | +13.8 percent | -3.2 percent | -13.4 percent | $432M | -0.7 percent | +11.2 percent |
| Frankfurters | +0.2 percent | +24.0 percent | +22.5 percent | +15.8 percent | +17.1 percent | -9.9 percent | -14.6 percent | $262M | -8.8 percent | +0.3 percent |
| Breakfast sausage | +1.8 percent | +14.3 percent | +35.8 percent | +20.0 percent | +13.6 percent | +2.3 percent | -15.0 percent | $182M | +1.1 percent | +19.3 percent |
| Smoked ham | -0.9 percent | +32.7 percent | 30.7+ percent | +17.1 percent | +3.8 percent | +1.3 percent | -23.7 percent | $70M | -3.3 percent | +11.8 percent |
| Processed chicken | +1.4 percent | +16.7 percent | +14.2 percent | +11.2 percent | +16.8 percent | +5.8 percent | +8.4 percent | $65M | +16.0 percent | +27.1 percent |
Source: IRI, Integrated Fresh, Total US, MULO, percent change vs. YA
Grinds — Renewed Growth for Ground Beef
August also marked the return to positive territory for ground beef. During the five August weeks, ground beef generated $1.1 billion, up 4.8 percent over year ago and up 15.1 percent versus 2019. Other grinds with year-on-year gains included turkey, chicken and pork.
| percent sales change (August 2021) versus year ago | Dollar sales |
Dollar gains vs. 2020 | Dollar gains vs. 2019 |
| Ground beef | $1.1B | +4.8 percent | +15.1 percent |
| Ground turkey | $137M | +2.5 percent | +10.9 percent |
| Ground chicken | $22M | +8.2 percent | +28.3 percent |
| Ground pork | $16M | +6.1 percent | +23.2 percent |
| Ground lamb | $4M | -9.1 percent | +16.9 percent |
| Ground veal | $1M | -3.5 percent | +22.8 percent |
Source: IRI, Integrated Fresh, Total US, MULO, percent change vs. YA
What’s Next?
The elevated COVID-19 case counts prompted some reversal in the normalization of shopping patterns, but nothing like the changes seen in 2020 or earlier this year. Engagement with restaurants remained high even if slightly fewer people ate on premise. The mix of food service and retail solving consumer meal needs remains tipped to the retail/at home side for the foreseeable future as it has been since March 2020.
As of yet, most school districts are planning to resume in-person education. As of the second week of August, the IRI survey found that:
- 11 percent of kids ages six to 12 and 14 percent of teenagers will be in virtual education.
- 4 percent of children 6-12 and 5 percent of teenagers will be in hybrid education (a combination of virtual and in person)
- 79 percent of children 6-12 and 37 percent of teenagers will be at school in person.
This is in vast contrast to August 2020 when 58 percent of children were in virtual education and only 16 percent of children attended school in person.
Additionally, fewer people are working from home. In August 2020, 34 percent of primary shoppers in the IRI survey were working from home five days a week versus 28 percent in the August 2021 wave. Likewise, the share who works from home one or more days a week decreased from 53 percent to 46 percent.
This may have implications for items that are typical lunchbox solutions as well as change the dynamics between units and volume. Since the start of the pandemic, large servings/family packs have been popular, resulting in stronger volume versus unit gains. However, with schools and offices reopening, we may start to see a shift back to more on-the-go, single-serve solutions.
The next performance report in the IRI, 210 Analytics and Marriner Marketing series will be released mid-October to cover the September sales trends.
Date ranges:
2019: 52 weeks ending 12/28/2019
Q1 2020: 13 weeks ending 3/29/2020
Q2 2020: 13 weeks ending 6/28/2020
Q3 2020: 13 weeks ending 9/27/2020
Q4 2020: 13 weeks ending 12/27/2020
Q1 2021: 13 weeks ending 3/28/2021
Q2 2021: 13 weeks ending 6/27/2021
August 2021: 5 weeks ending 8/29/2021

