
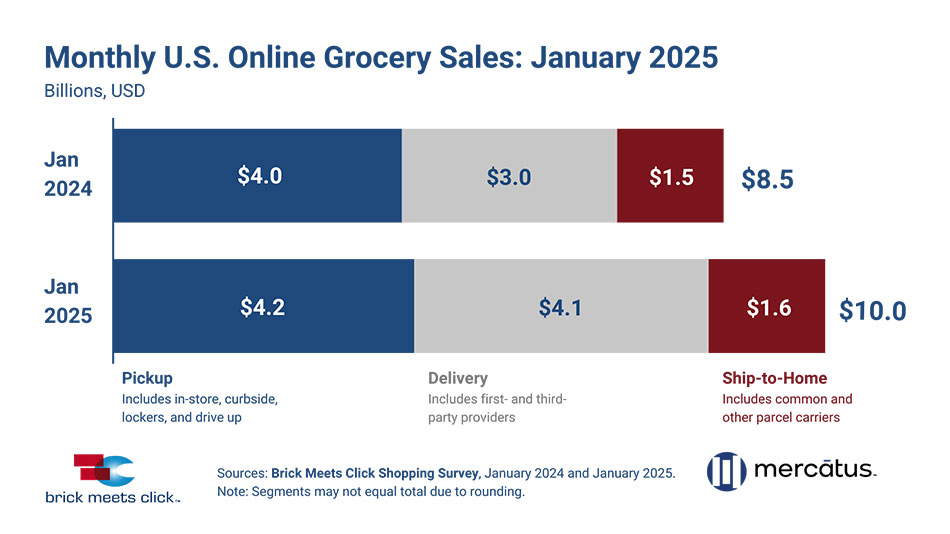
The U.S. online grocery market finished January with $10 billion in monthly sales, a 16.6 percent increase over last year as all three fulfillment methods posted year-over-year (YOY) sales gains, according to the Brick Meets Click Grocery Shopper Survey fielded Jan. 30-31, sponsored by Mercatus.
January marked the sixth consecutive month of online grocery sales above $9.5 billion, fueled in large part by the broad discounts on membership and/or subscription programs.
Delivery’s YOY growth in January accelerated even faster than the prior month, surging about 37 percent to $4.1 billion, as it continued to benefit from the various promotional discounts on memberships and subscriptions that have continued since mid-2024. Delivery posted an exceptionally strong expansion in its monthly active user base (MAUs), strong gains in order frequency and a nominal increase in average order values (AOVs). This momentum helped delivery finish January with 41 percent in online grocery sales.
“It’s important to call out that much of delivery’s explosive growth is driven by mass and specifically Walmart,” said David Bishop, partner at Brick Meets Click.
“The ongoing waves of promotional tactics are having the intended positive impact on frequency and spend, and they are also increasing retention and share of wallet, which will make growth for their rivals more challenging going forward.”
[RELATED: FMI, NielsenIQ Report: Shoppers Blend In-Store, Online Experiences]
Pickup’s positive YOY growth was muted compared to delivery’s surge. Pickup sales climbed 4 percent versus last year to $4.2 billion, driven by stronger AOVs, which offset a contracted MAU base and a drop in order frequency. The headwinds facing pickup are due largely to the impact of the promotional efforts that are driving demand toward delivery. This has led pickup to end January with 42 percent of online sales, just slightly ahead of delivery.
Ship-to-home sales jumped 9 percent in January compared to last year to $1.6 billion. Strong expansion of its MAU base and increased order frequency fueled the gains despite a YOY decline in AOV. Ship-to-home continues to benefit to some degree from a suboptimal in-store shopping experience related to certain general merchandise and health and beauty care products being locked up to prevent theft. However, like pickup, ship-to-home’s lagging rate of growth versus delivery caused it to end January with 16 percent of all online grocery sales.
Grocery operators, which include both supermarkets and hard discounters, continue to face stiff competition from mass rivals and specifically Walmart as it leverages delivery and its Walmart+ membership program to gain market share. In terms of household monthly penetration, the mass format has consistently served about half of all the MAUs during each January since 2022, whereas supermarkets have served one third of MAUs and hard discount under 5 percent of MAUs.
“Delivery’s impressive growth has been driven by membership promotions, but shoppers can easily shift platforms depending on which factor matters most to them – price, product or convenience,” said Mark Fairhurst, chief growth marketing officer, Mercatus.
“Grocers that prioritize seamless experiences, deliver personalized offers, provide exceptional service and implement compelling loyalty strategies will be best positioned for sustainable, long-term growth.”
While monthly online grocery sales climbed significantly during January, up 16.6 percent YOY, overall grocery spending climbed just 2.5 percent versus last year. As a result, online’s share of total grocery sales rose to 15 percent for January.
About the research
The Brick Meets Click Grocery Shopping Survey is an ongoing independent research initiative created and conducted by the team at Brick Meets Click and sponsored by Mercatus.
Brick Meets Click conducted the most recent survey on Jan. 30-31 with 1,691 adults, 18 years and older, who participated in the household’s grocery shopping, and a similar survey in January 2024.
Results are adjusted based on internet usage among U.S. adults to account for the non-response bias associated with online surveys. Responses are geographically representative of the U.S. and weighted by age to reflect the national population of adults, 18 years and older, according to the U.S. Census Bureau.