Thirty-six percent of U.S. families have skipped meals due to financial reasons in the last year, according to the fourth wave of the dunnhumby Consumer Trends Tracker study released Aug. 2.
The quarterly study – now completing its first year – also found that 30 percent of Americans across all age groups reported they have skipped meals due to financial reasons. In addition, 18-34-year-olds and 35-44-year-olds have the highest rate of skipping meals out of any age group at 38 percent and 37 percent, respectively.
The study also found that 62 percent of Americans would have a hard time paying an unexpected expense of $400. That percentage jumps to 75 percent for consumers between the ages of 18-44 and to 72 percent for families.
The Consumer Trends Tracker study is part of The dunnhumby Quarterly, a strategic market analysis of key retail themes. More than 8,000 U.S. consumers were surveyed online across the four waves of this study.
“Over this year-long study, we have seen a very troubling trend of nearly a third of all Americans and nearly 40 percent of younger Americans skipping meals due to financial concerns. And wave after wave, our research has also shown that 18-44 year-olds are at the epicenter of a food and financial insecurity crisis that shows no signs of abating,” said Matt O’Grady, president of Americas for dunnhumby.
“Unfortunately, the reduction in SNAP benefits, and the stubbornness of center store prices, there doesn’t appear to be relief in the short term for many Americans, especially those who are already food and financially insecure.”

Key findings from the study:
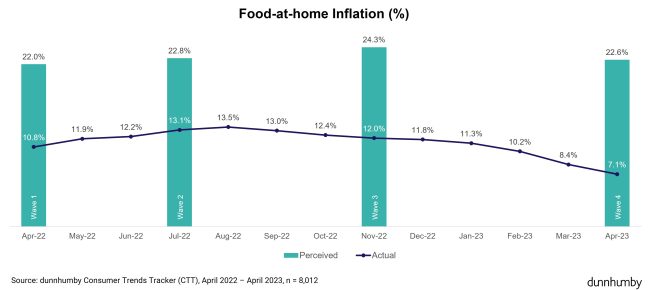
- Americans are not yet feeling relief from the drop in the food-at-home inflation rate and believe it is 15 points higher than the actual 7.1 percent annual rate as measured by the U.S. Bureau of Labor Statistics. While the latest measurement of consumers’ perception of food inflation has dropped 1.6 percent (to 22.6 percent), food inflation has actually dropped 4.9 percent since the last wave of the report.
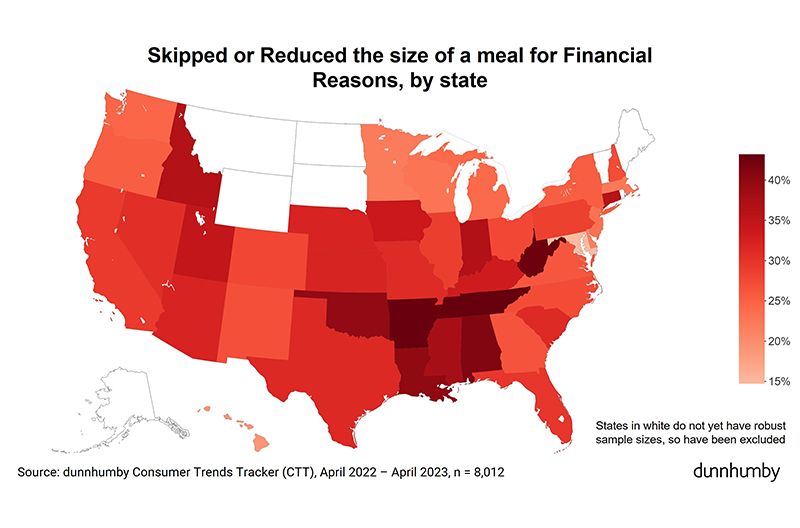
- The Southern states of Oklahoma, Arkansas, Louisiana, Alabama, Tennessee, Georgia and West Virginia continue to stand out for having the highest rate of food (36 percent) and financial insecurity (70 percent) in the country. These states also have the highest proportion of children at home compared to other geographic regions in the U.S.
- More consumers are looking for deals, with 40 percent reporting they are shopping at different stores to find the best value, a 9 percent increase year-over-year. Consumers are most willing to shop around for non-alcoholic beverages (60 percent), packaged foods (55 percent) and frozen food (54 percent). Similarly, 41 percent of consumers are shopping around to get all the products they need, up 5 percent from wave three and up 6 percent year over year.
- Consumers have steadily increased their usage of omnichannel resources over the last year to optimize their grocery shopping and save money. Twenty-eight percent of consumers now order groceries online for delivery at least some of the time (9 percent increase year-over-year). Those checking prices online before or during a shop has also increased by 9 percent year-over-year, up to 40 percent. In addition, 37 percent now interact with retailer apps (7 percent increase year-over-year), which is consumers’ second most preferred method of being contacted by a retailer, with email being the first.
- Eighty percent of consumers use at least one grocery rewards program, with 20 percent being light users, 44 percent are medium users and 16 percent are heavy users. Heavy grocery reward users spend an average of $79 more in-store on groceries every month than non-loyalty customers. They also are more likely to be from households with children at home, are between 35-44 years old and have a household income of more than $100,000.
- Over half of customers (53 percent) report social media sites have influenced their grocery purchases in-store or online. Families with children at home (75 percent) and households heavily engaged with loyalty programs (68 percent) are two groups even more likely to be influenced by social media. Across all age groups, 37 percent were influenced by Facebook, 31 percent by YouTube and 24 percent by Instagram.
“Consumers changing shopping behavior over the last year, including cross-shopping stores for the best prices and increasing their omnichannel behavior, has created an opportunity for retailers and brands to engage with them in a personalized way,” O’Grady said.
“Those that are able to understand the different needs of their customers and then deliver to them tailored content and offers that provide real value, will be able to drive customer loyalty in a very competitive environment.”
Methodology
After the first year of the CTT, dunnhumby has interviewed 8,012 consumers, representative of the U.S. grocery shopper nationwide. The online interviews for Wave 1 were conducted in April 2022, Wave 2 in July 2022, Wave 3 in November 2022, and Wave 4 in April. Approximately 2,000 people were interviewed for each wave of the study.

