Dunnhumby, a provider of customer data science, has released findings from its 18-month worldwide study of the impact of COVID-19 on customer attitudes and behavior across 24 countries.
The eighth wave of the dunnhumby Consumer Pulse Survey found that 64 percent of U.S. consumers reported that grocery stores are not doing a good job with COVID-19, compared to February 2021 when 50 percent of respondents reported grocers were doing a good job. 
Furthermore, 83 percent reported that the government isn’t doing a good job either, marking the lowest point of confidence in the government’s handling of the crisis and the second-lowest globally.
Consumers’ concerns with grocery stores span from worries that things are not returning to normal (76 percent), unvaccinated shoppers in the stores (34 percent) and still extremely worried about the virus (26 percent). Although 21 percent said there was no store that provides good value for the money, Walmart continues to be cited as providing the best value (29 percent), with Aldi (12 percent), Kroger (7 percent) and Target (6 percent) following respectively. Amazon fell out of the top five stores for value and landed with 4 percent.
“After living with the pandemic for 20 months, consumers are now twice as concerned about their personal finances as they are about Covid itself. With inflation persisting and government stimulus’ phased out, the majority of shoppers are now looking for greater value,” said Grant Steadman, president for North America at dunnhumby. “Retailers who are perceived as offering more value and respond to their customers’ increasing need for this, will earn the loyalty of the new customers they gained during the early phases of the pandemic.”
Key findings
Key findings from the study include:
- Shopping trips and restaurant patronage is returning to pre-pandemic behavior. During the 18-month study, consumers have changed how often they shopped from a low of just 3.8 trips a week in March 2020, to 5.6 trips a week in July 2020, to six trips a week in September 2021. Similarly, over the same period, visits to restaurants for carryout, delivery or eat-in have ranged from a March 2020 low of 62 percent of consumers, to 78 percent in July 2020, and 82 percent in September 2021, the highest amount since the start of the study. The number of consumers eating in a restaurant has also increased from just 10 percent in March 2020 to 49 percent in September 2021, also the highest point in the study.
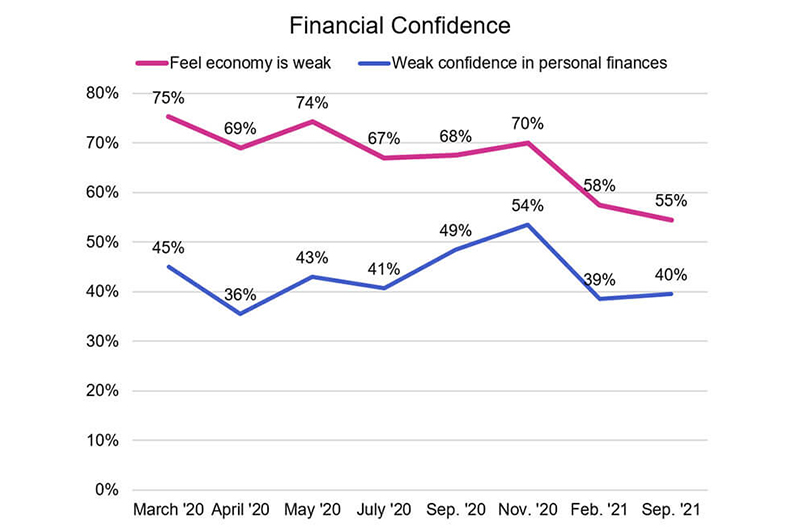
- While consumers’ outlook on the economy has improved, 55 percent still feel the economy is weak, and 40 percent report that their personal finances are also weak. Over the eight waves, consumers’ perception of the state of the economy has improved by 20 percentage points compared to just a five point improvement in how they feel about their own personal finances. Globally, Brazil (75 percent), Thailand (69 percent) and France (63 percent) are at the bottom with their consumers reporting their personal finances are weak.
- Levels of worry about COVID-19 in the U.S. have continued to drop and are at their lowest level (17 percent), a 14 point drop since March 2020. The U.S. is in the lower half of countries surveyed on the dunnhumby Worry Index with Brazil (39 percent), Malaysia (38 percent), Chile (38 percent), Thailand (35 percent), Portugal (35 percent), Mexico (33 percent) and Japan (31 percent) in the top half of countries reporting higher levels of worry.
- Value-seeking consumers (66 percent) continue to surpass quality seeking consumers (19 percent), although value seekers’ numbers declined slightly (five points) since the last wave. The two most common behaviors are shopping at stores with the lowest prices (55 percent) and shopping at stores with the best quality (44 percent). Next are stocking up when things go on sale (36 percent) and paying more for quality (30 percent).
- The number of people who shop both store and online has increased to 47 percent since the beginning of the pandemic, when it was at 35 percent. The U.S. is in the middle of countries in the number of omni-channel shoppers, with China leading all at 97 percent and Hungary trailing at 19 percent. Satisfaction in the U.S. with online shopping is now identical to that for in-store shopping, 32 percent.
Cash remains king as the dominant payment method (49 percent), followed by traditional credit cards (46 percent) and debit cards (41 percent), with mobile apps trailing (13 percent).
Just 14 percent of U.S. survey respondents are concerned with data privacy. Only in China and Thailand do more than 20 percent of consumers seem concerned.
Methodology
For this study, dunnhumby surveyed 58,089 respondents online in 24 countries: Asia (Australia, China, Japan, Malaysia, Thailand), Europe (Czechia, Denmark, France, Germany, Hungary, Ireland, Italy, Norway, Portugal, Slovakia, Spain, United Kingdom), Latin America (Brazil, Chile, Colombia) and North America (United States, Mexico). The online interviews were conducted for Wave One from March 29-April 1, 2020; Wave Two from April 11-14, 2020; Wave Three from May 27-31, 2020; Wave Four from July 9-12, 2020 in the U.S., Canada and Mexico only; Wave Five from Aug. 28-Sept. 3, 2020; Wave Six from Nov. 20-25, 2020; Wave 7 from Feb. 18-24, 2021; and Wave 8 from Aug. 27-Sept. 3, 2021.
Approximately 400 individuals were interviewed in each country for each wave of the study, and respondents were roughly 60 percent female and 40 percent male.
The dunnhumby Consumer Pulse Survey is available for download today.

